
Strong economic drivers have helped the Atlanta metro maintain “hot spot” status; nevertheless, lenders should be aware of several critical due diligence developments.
This series of articles will examine due diligence in various hyperlocal markets that tend to be representative of their region.
We’ll look at some primary markets, secondary markets, recreational markets, rural/agricultural markets, and others. Within the context of a selected market, we’ll consider current trends, demonstrate differences, and identify unique diligence factors that savvy lenders and investors should be aware of.
Here’s an overview of the three factors we’ll be discussing for each market:
- Local refers to understanding a market from the MSA level as well as its specific location within the MSA. These factors are broad, and they help evaluate the market’s type and size (i.e., primary, secondary, tertiary, rural, remote), economic drivers, size of the buyer pool, and typical buyer profiles.
- Hyperlocal refers to understanding a specific neighborhood, its submarket, investment dynamics, and other neighborhood-level intelligence.
- Unique diligence factors are specific diligence factors that are important to check within a certain local/hyperlocal area. They are important to examine to ensure the environmental health and safety of the property. For example, throughout much of Atlanta, as in other markets, finished basements are often incorrectly reported. The presence/absence of a finished basement can typically have a significant impact on property value.
Real estate investors are very familiar with “Location, location, location.” That adage actually tells us more than we might think. It represents three due diligence factors critical to the success of any investor: local, hyperlocal, and unique diligence factors.
The first installment in the series focuses on Atlanta, Georgia, which has been a hot spot for real estate lending and investing for years, even as other traditionally “hot spot” markets have experienced fluctuations.
Local
Atlanta is typically categorized as a primary market. It has strong economic drivers with a large, sustained pool of buyers. Buyer profiles cover the spectrum from rental, workforce housing, urban, suburban, executive, luxury, and retirement.
The following are some important trends we’re seeing, based on aggregated data from all properties analyzed (but not necessarily purchased) by lenders and investors on RicherValues, either by clients conducting their own analysis or by ordering our evaluation reports.
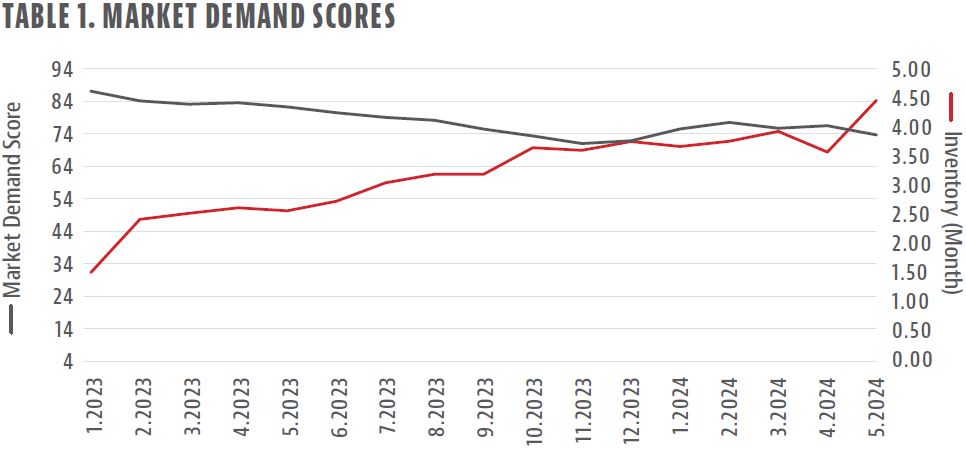
Declining market demand. Market demand scores have been steadily declining, largely driven by inventory levels that have been steadily climbing. Table 1 illustrates the change in market demand score from 1.6 months to sell in January 2023 to 3.5 to 4.5 months from March to May 2024. Although these levels are higher than compared to six months ago, they remain at decent levels. Historically, many industry professionals consider five to six months a healthy range, but it’s also the tipping point at which markets switch from sellers’ markets of low inventory to buyers’ markets of high inventory.
Moving back into pockets with greater price variation. After enjoying some local pockets of simpler deals (i.e., properties located in neighborhoods where home prices show less variation) from June to September 2023, investors and lenders are moving back into areas that exhibit more price variation. The implication is that lender/investor deals being analyzed are beginning to require greater levels of diligence within the valuation world to ensure they accurately quantified the deal.
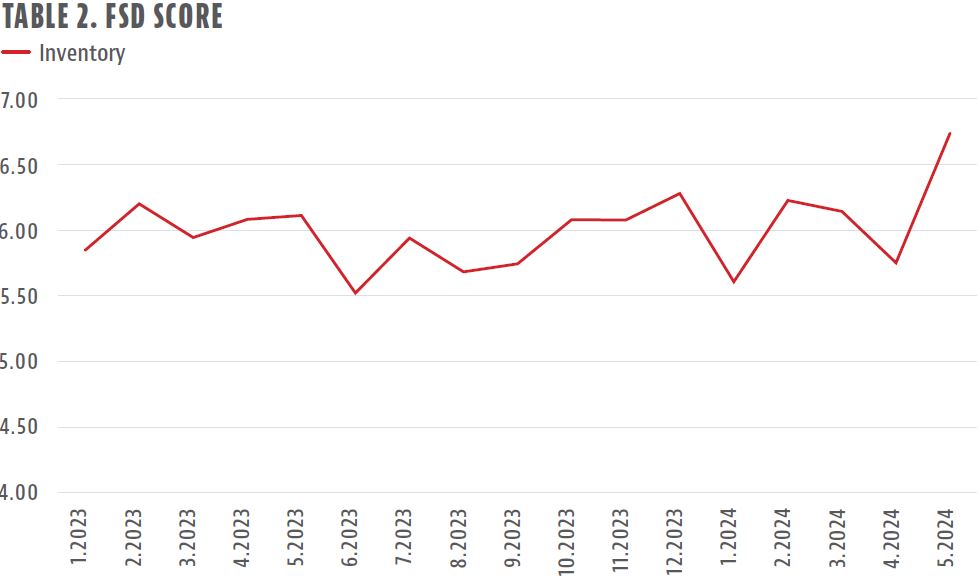
Table 2 shows the FSD (forecast standard deviation) score from January 2023 to late May 2024. You can think of the FSD as a reverse confidence score. It measures the accuracy of analytical models used to determine a property’s value. A lower score means the model has more effectively identified sales price drivers, yielding greater confidence in the valuation. A higher score indicates an area has greater variation in sales prices and it was harder for the models to determine what specifically is driving price; therefore, a human touch is likely needed to sort through the details and ensure valuation conclusions are accurate.
A shift away from $250,000 to $400,000 After Repair Value (ARV). There has been a steady decline in the percentage of deals analyzed by lenders and investors that fall within $250,000 to $400,000 based on ARV. Although still a staple, this value band has seen a steady decline that has led to a 5- to 10-point drop in the percentage of mid-level properties as the focus shifts to both ends of the value spectrum. There has been a 3- to 5-point shift toward properties with less than $250,000 ARV and 5- to 8-point shift toward properties with greater than $750,000 (see Table 3).
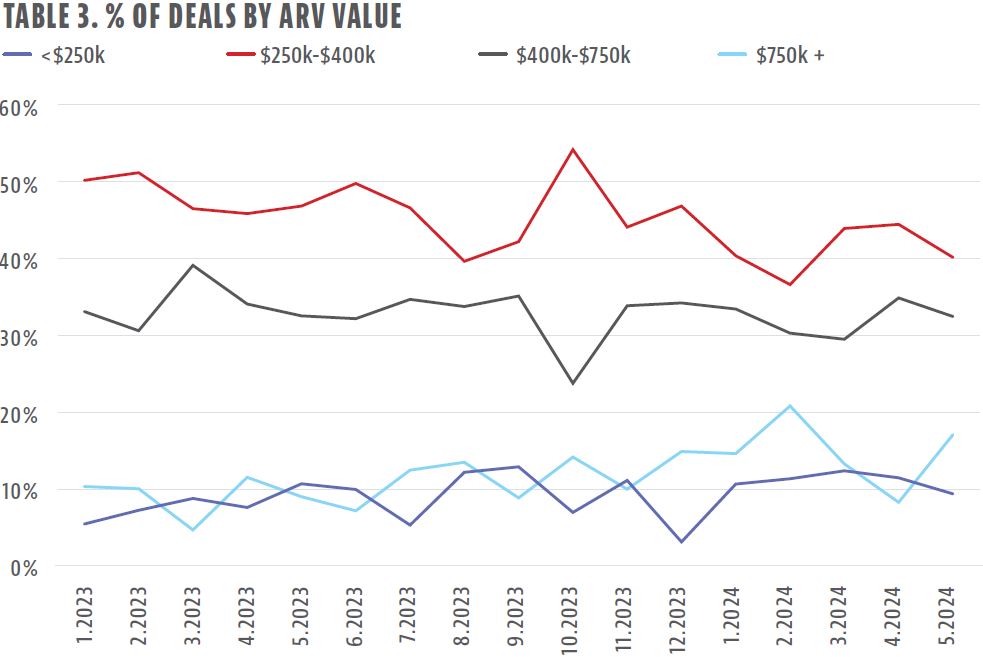
Although inflation may have pushed some properties into the higher value ranges, based on growth in the under $250,000 range, we can infer that shifting appetites or shifting availability of deals are the primary drivers rather than inflationary issues.
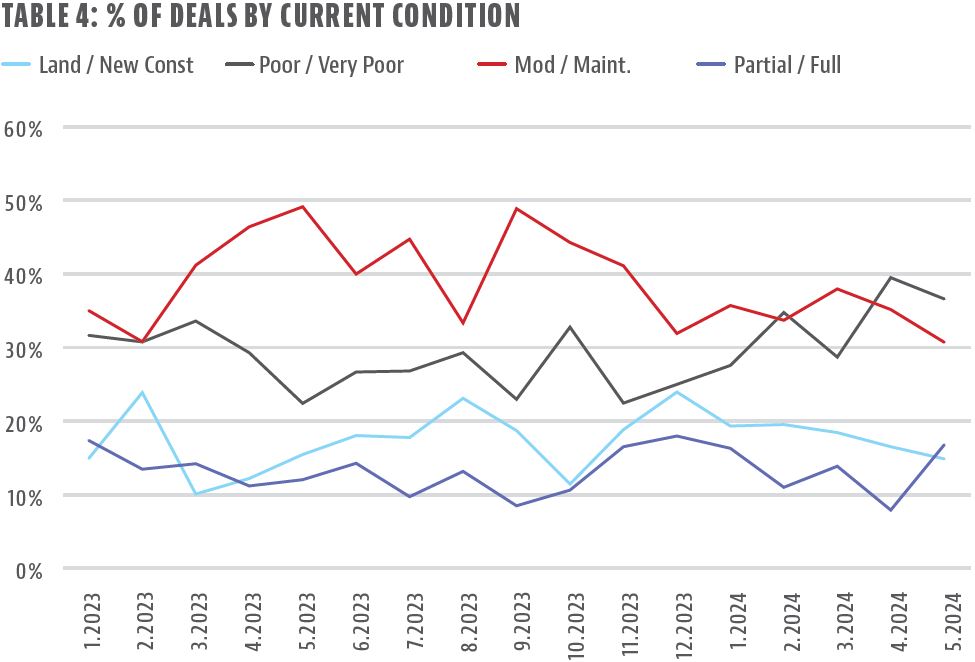
Heavier construction. After enjoying a resurgence of light rehab deals with properties in moderate/maintained condition (C3-C4) from March to November 2023, there has been a noticeable 5- to 10-point shift away from these lighter rehabs. The percentage of deals in poor to very poor condition (C5-C5.5) has increased steadily from November 2023 to May 2024. Analysis of new construction (built or to-be-built) has remained steady and strong—in the 15-20% range (see Table 4).
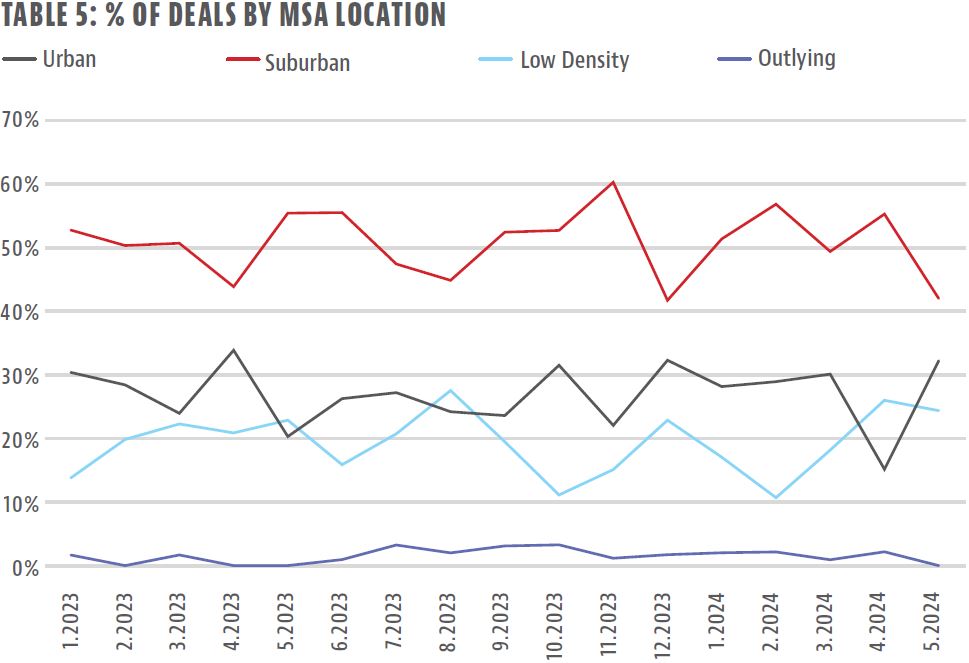
Back to outer areas. In most MSAs, there’s a constant fluctuation between deals in the inner core (urban/suburban) areas versus outer areas (lower density suburban and outlying). Atlanta is no exception. The percentage of deals in lower density suburban or outlying areas recently increased to 25% from March to May 2024, after averaging 18% from October 2023 to February 2024. (see Table 5). This means investors are procuring or analyzing more deals in outer areas of the MSA as opposed to central/core areas and cities. This can be a common market response when inventory is low, although it could also be due to investor competition or saturation in more central, popular areas of the larger market.
Hyperlocal
Much of the Atlanta MSA is suburban and has lower density markets. As with any MSA, investors and lenders must do their best to understand a specific location, gathering neighborhood-level intelligence on the immediate area, submarket, and investment dynamics. The metrics to be searched for should be measured at the hyperlocal level to help quantify hyperlocal activity, supply/demand balances, investment activity, and other factors.
Here is a short list of factors that we commonly see as important for Atlanta properties:
- Market demand activity, including inventory, renovation activity, and other factors. These are important in basically every hyperlocal area in the country.
- Age and historic or development districts—old does not mean historic! Sometimes borrowers/agents will try to brand properties as “historic” (for old and heavy work needed) or in a “development area” (for rundown neighborhoods). Lenders should not take the marketing at face value and instead uncover whether an old property is actually historic and/or if it’s in a historic area or an area designated for development and revitalization.
- Neighborhoods, often drawn with invisible lines, can critically impact property value. These lines might reflect school districts, golf courses/country clubs, or certain property specs like style/vintage/lot size.
- For the subject property and surrounding areas, which asset class (A/B/C/D) dominates the area? And what about for the subject block?
- Crime statistics can be a tangible way to evaluate hyperlocal areas, perhaps even with income-level demographics.
Unique Diligence Factors
Atlanta has experienced sustained infill redevelopment and renovation for more than 10 years, and we’ve generally found the area to be “analysis friendly” (if that’s a term!), meaning we haven’t found too many unique pitfalls. Still, there are a few key items that are common for conducting diligence and valuation assessments in Atlanta and the surrounding areas, including:
Multiple and overlapping MLS bodies. Many areas of the MSA are potentially covered by more than one Multiple Listing Service (MLS), so listings can appear in one or both. This is important to be aware of when you conduct valuation assessments because duplicated listings can inaccurately weight property analysis. Work with a platform that has access to all the area databases, ideally one that works to eliminate duplicates. Better still, keep an eye out for duplicate listings.
Finished/unfinished basements. These data fields are commonly incorrect, either intentionally or unintentionally misreported. It’s important to conduct extra diligence on subject properties and nearby comparables with respect to above/below grade square footage numbers.
A mix of sewer vs. septic. With a wide variety of vintages throughout many pockets of the MSA, it’s important to make sure you understand sewer/septic, particularly for large value-add renovations and/or new construction projects.
Year built/new construction vs. renovation. Sometimes, MLS agents will list properties as new construction when the property has been renovated, or vice versa. This can occur when a misinformed agent inputs information in error, or it could be an intentional misrepresentation. In either case, checking county records can help, although that’s not always an ideal source. Many comps, therefore, require a hands-on analysis to ensure you’re conducting your analysis with the most accurate information.
Neighborhood-level factors such as different sides of the train tracks, cemetery or other factors. Many pockets host a spectrum of asset classes (A/B/C/D) within a relatively close-knit area, and analyzing stats “on paper” or from a simple map can sometimes lead one astray.
Although there’s always so much more to say, this short look into the popular Atlanta MSA provides guidance not just for lenders and investors active in Atlanta but for all lenders. This market-based approach provides an opportunity to see how local, hyperlocal, and unique diligence factors all play an important role in understanding prospective deals and making smart lending decisions.


Leave A Comment