
With DSCR loan volume up 105% year-over-year, top performers aren’t riding the wave—they’re creating it through better execution and infrastructure.
Lightning Docs is a SaaS platform founded by the partners at Fortra Law —recently rebranded from Geraci LLP—the nation’s largest private lending law firm. The platform is used by nearly 300 total lenders, including more than half of the top 50 private lenders nationally and six of the current top 10. This combination of depth and breadth offers a unique window into the private lending market. This article recaps first quarter 2025, highlights national trends through April, and takes a close look at regional activity across the top bridge and DSCR markets.
Q1 2025 Recap
Private lending showed no signs of the typical early-year slowdown in first quarter 2025. Bridge loan volume was up 48% year-over-year (YOY), and DSCR loans surged 108% YOY.
But the growth story is nuanced. When reviewing data aggregator Forecasa’s statistics and tracking the YOY progress of the top 100 national private lenders, 51 of the leading lenders either decreased or were exactly flat when comparing first quarter 2025 to first quarter 2024. Looking solely at file counts for the top 100 lenders, volumes increased by 6% over the same period.
With market volatility still top of mind, it’s more important than ever for private lenders to keep an eye on rate movements and market signals. Encouragingly, despite recent swings in equity and debt markets, the secondary market for private lenders remains strong. If that holds, loan volume could continue its upward trajectory.
Let’s now turn to the latest trends through April.
National Trends
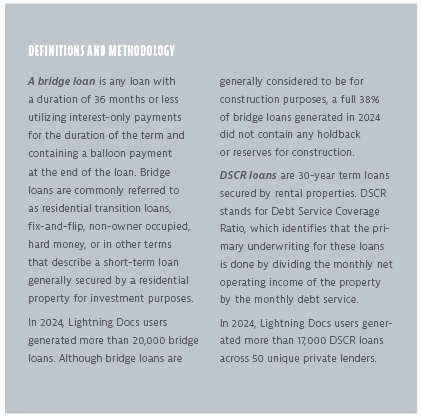
Bridge Loan Volumes. April 2025 was once again an all-time high for bridge loan transactions written in Lightning Docs. With a total of 2,634 loans, April marked the fifth month in a row that has set a new high. When tracking the same 165 users who signed up to use the system on or before January 1, 2024, we see a 48% YOY increase comparing volumes from 2025 to 2024 (see Fig. 1).
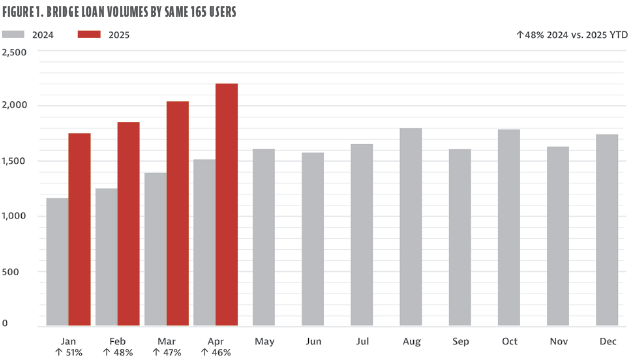
DSCR Loan Volume. Although growth for bridge loans has been impressive, the increase in transactions for DSCR loans remains the standout. DSCR loan volume once again set records in April with 2,504 loans in the system from the entire user base. When looking at the same 37 users who started using the system on or before January 1, 2024, DSCR volume was up a staggering 105% YOY (see Fig. 2).
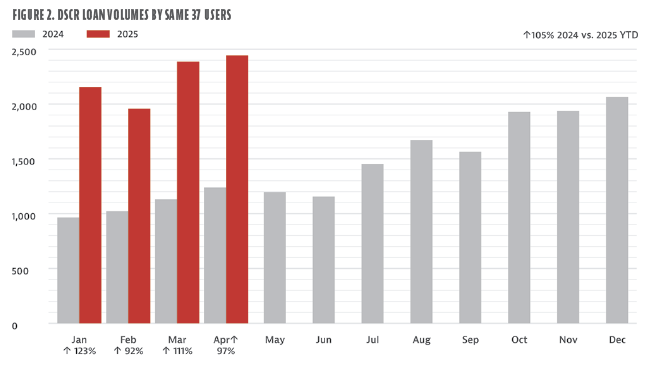
Bridge Interest Rates and Average Loan Amounts. National bridge loan interest rates dropped again in April, from 10.74% to 10.65% (see Fig. 3). With 11 decreases over the last 12 months, bridge loan interest rates are now 85 basis points lower than this time last year. Median rates held steady at 10.5%, narrowing the gap with the average.
Rate distribution shows 35% of loans falling between 10% and 10.99%, with an average April interest rate of 10.65%. A shift toward loans priced between 9% and 9.99% appears to be the driving factor in the overall decrease in averages. One key factor is that the dominant bridge loan market, Los Angeles, saw its average interest rate drop by nearly 50 basis points in April.
On the other hand, average loan amounts ticked up. The average climbed to $664,287, the highest since December, while the median held at $350,000. This points to a healthy mix: While large deals are lifting the average, most lending remains focused on mid-range transactions.
DSCR Interest Rates and Average Loan Amounts
DSCR rates fell four basis points to 7.52%, the fourth consecutive month after a sharp increase during the closing months of 2024 (see Fig. 4). Average loan amounts saw a slight dip to $317,604.
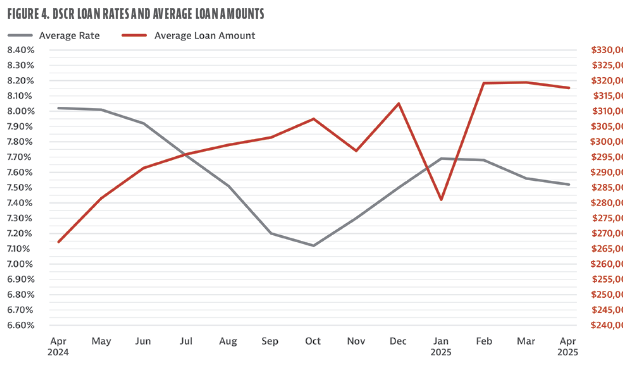
Although more than 63% of loans are still priced between 7% and 7.99%, the data is showing a meaningful shift toward lower rates. Similar to bridge loans, April’s top market for DSCR loans, Philadelphia, saw average interest rates drop by 19 basis points.
Index Spreads vs. Bridge and DSCR Loans. Despite a tumultuous month for federal economic policy, the 10-year treasury showed no movement from March to April, staying put at 4.28%. DSCR loans and consumer mortgages went in opposite directions, with consumer mortgages increasing by eight basis points, while DSCR rates dropped by four. As a result, the spread between DSCR loans and the 10-year treasury tightened to 3.24%, signifying confidence in the market, although not as aggressive as in fourth quarter 2024, when spreads were much closer to 3%.
Top Bridge Loan States. Through the first third of the year, the top 10 states for bridge loans have remained consistent with 2024. California, Florida, and Texas still lead, while North Carolina, New Jersey, and Pennsylvania have climbed the ranks (each up two notches). The complete top 10 list, ranked in order from top to bottom in 2025, include California, Florida, Texas, North Carolina, New Jersey, Illinois, Georgia, Pennsylvania, Massachusetts, and Ohio.
One factor worth noting: Each of these states ranks among the top 11 by population. The one major outlier is New York, which continues to lag due to its challenging mortgage lending dynamics.
Top DSCR Loan States. The top 10 states for DSCR loans have also held steady since 2024. Florida leads so far in 2025, with New York and Georgia making gains (both up two spots over 2024). For lenders looking to expand into new markets, Washington and Massachusetts stand out as highly populated states where DSCR volume remains relatively low. The complete top 10 list through 2025 includes Florida, Pennsylvania, Ohio, Texas, New Jersey, New York, California, Georgia, Illinois, and North Carolina.
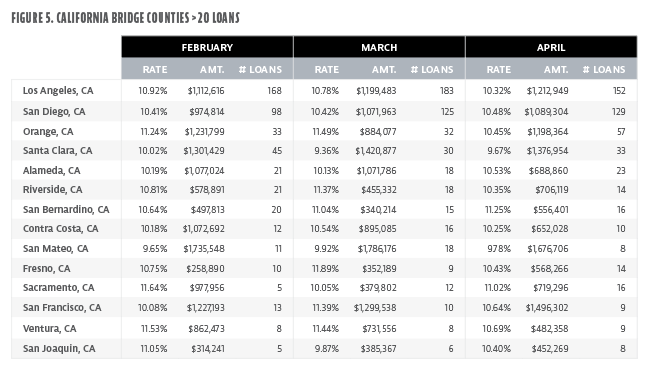
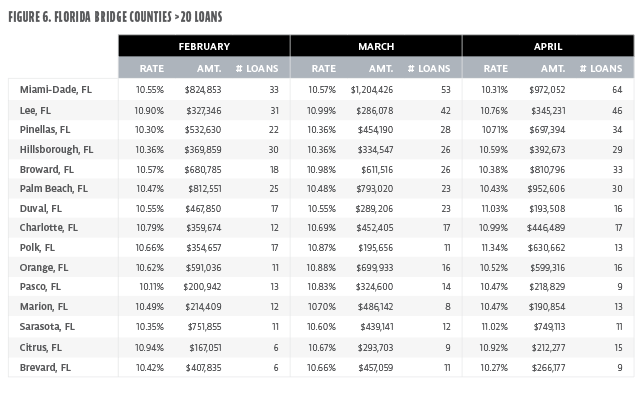
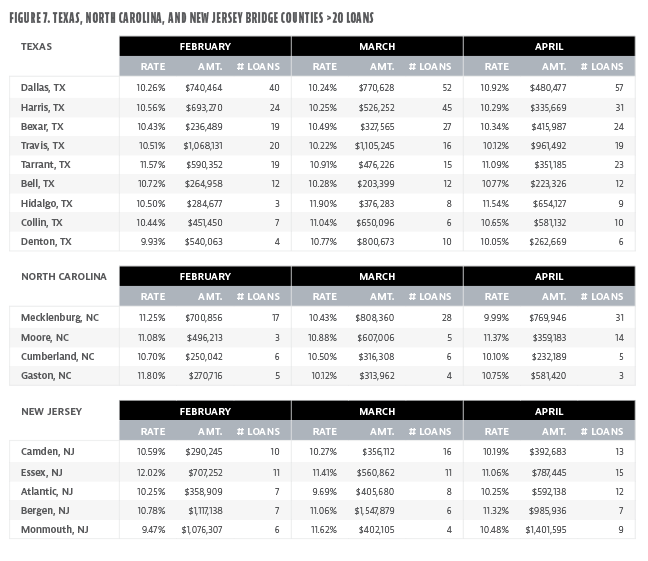
Hot Spots in Bridge States. Although it’s helpful to know which states are hot spots for bridge loans, knowing exactly where the best markets within these states are located offers even better insights. Let’s take a look at the counties recording at least 20 bridge loans this year within the top five states—California, Florida, Texas, North Carolina, and New Jersey (see Figs. 5-7). Some, like California and Florida, have many counties that are driving volume; others, like North Carolina and New Jersey, have just a handful of counties over this threshold.
Orange County, California, saw the biggest increase in the number of transactions from March to April, along with average loan amounts increasing over $300,000 (see Fig. 5).
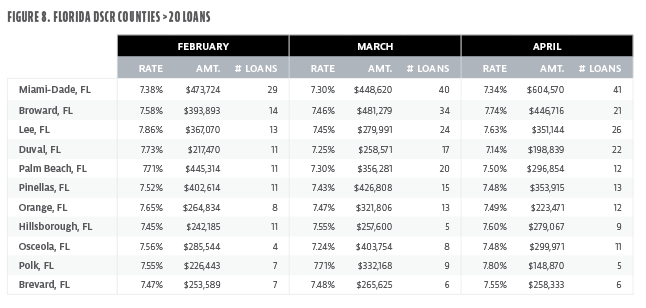
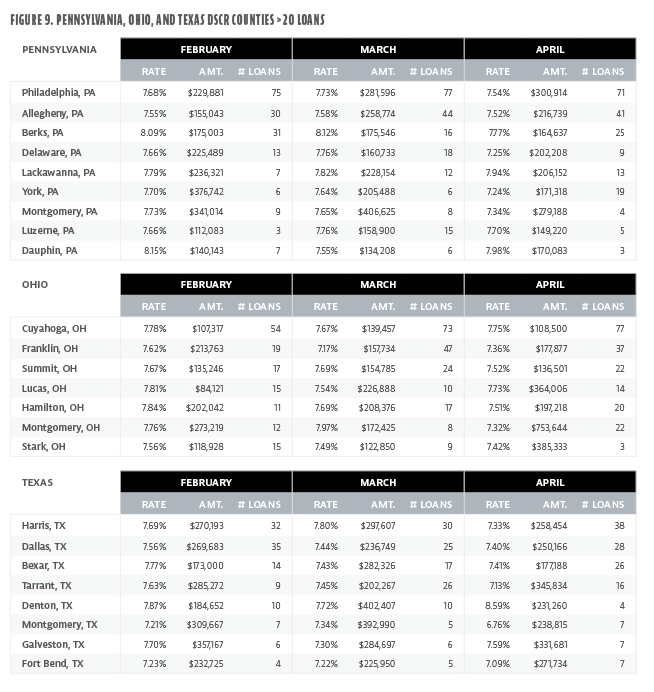
Hot Spots, DSCR Markets. Similarly, let’s look at the top markets that make up the leading DSCR states—Florida, Pennsylvania, Ohio, Texas, and New Jersey (see Figs. 8 and 9). As an overall trend, DSCR markets show much less volatility in average interest rates and loan amounts.
DSCR loans across Florida’s top counties are consistently priced. Average interest rates across the last three months for all 11 counties shown fell between 7.14%-7.86%. Orange represents the median county for average loan amount in 2025 when reviewing the 106 counties that had at least 20 DSCR loans through April (see Fig. 8).
Pennsylvania’s top counties serve as a bellwether for the national average interest rate with Philadelphia matching it at 7.68% in February and Alleghany matching the 7.52% national average in April.
Ohio remains a key state for small volume loans. Of the 106 counties with at least 20 DSCR loans this year, Cuyahoga, Summit, and Stark counties are all among the top 10 for the lowest average loan amount.
Many of the Texas counties lie near the median loan amount when looking at top markets. A review of the 106 counties with more than 20 DSCR loans this year shows Galveston, Harris, Montgomery, Dallas and Tarrant all landing within 10 spots of the median county (see Fig. 9).
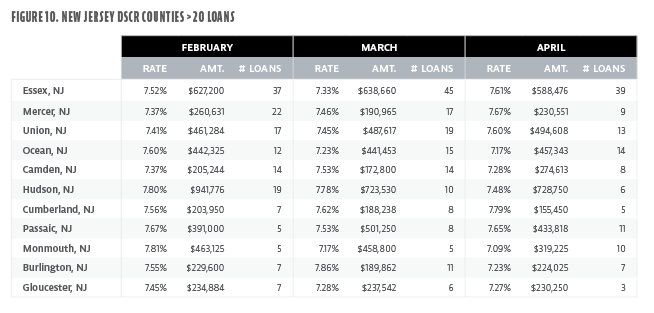
Looking at all the counties in these top five states, Essex and Hudson in New Jersey stand out, with average loan amounts more than double the national average, by far the highest among this group (see Fig. 10).
Execution, Not the Economy, Determines Market Leaders
Macroeconomic conditions impact all lenders equally, but outcomes vary widely. Half of the top private lenders saw volumes decline or stay flat in the first quarter of this year; the other half grew. The difference wasn’t the economy; it was execution.
Lenders are well served by focusing on better execution in their businesses, including streamlining processes. At Lightning Docs, we consistently see our users outperform their peers by wide margins. The reasoning is easy to appreciate: Lenders focused on building strong foundations from which to
scale will continue to dominate in
uncertain markets.


Leave A Comment