
Origination numbers are up even as loan amounts level off.
Following a rate cut in December 2024, the Federal Reserve has maintained the same federal funds target rate for the first four consecutive FOMC meetings in 2025. They remained cautious due to inflation concerns and economic uncertainties.
Volume and Growth Changes
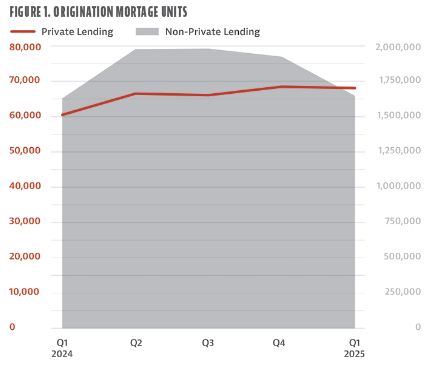
First-quarter 2025 saw a 13% increase in private lending mortgage origination units compared to first-quarter 2024 (see Fig. 1). Total origination volume also increased by 10%. DSCR (Debt Service Coverage Ratio aka 30/40-year term loans) experienced an increase in originations of 43% from first-quarter 2024 and saw a 25% increase in total number of private lenders offering DSCR loans. Overall, the total private lending origination volume for first-quarter 2025 surpassed $33.2 billion compared to first-quarter 2024 finishing at $30.7 billion.
The average private lending mortgage loan amount dropped slightly from $517,000 to $508,000, but the overall increase in transaction count drove a year-over-year (YOY) increase. Genesis Capital and Anchor Loans saw the biggest increase in average mortgage amount, with 26% and 14% increases YOY, respectively. Six of the top 10 private lenders (by origination units) experienced a contraction in average mortgage amount YOY.
The growth was shared among areas across the country. Specifically, in the largest areas, nine of the top 10 states saw an increase in originations compared to first-quarter 2024 (see Fig .2). More granularly, 18 of the top 20 MSAs saw an increase in originations compared to Q1 2024, and 13 of them saw a growth of more than 10%.
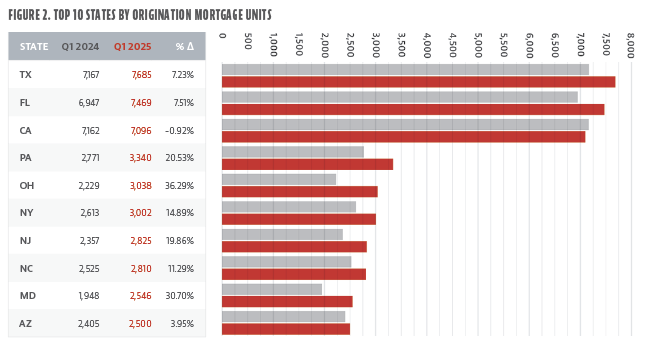
It is interesting to note that the Tier II (PA, OH, NY, NJ) and Tier III (NC, MD) saw larger increases in activity relative to the “Big Three” (TX, FL, CA). Tiers are determined using private lending units originated. California was the only state that experienced contraction and now is the third largest state by loan count; however, the loan sizes are much larger in California relative to Texas and Florida.
Average private lending mortgage amounts have changed significantly YOY.
Among the top 25 states, Forseca notes three YOY trends (see Fig. 3).
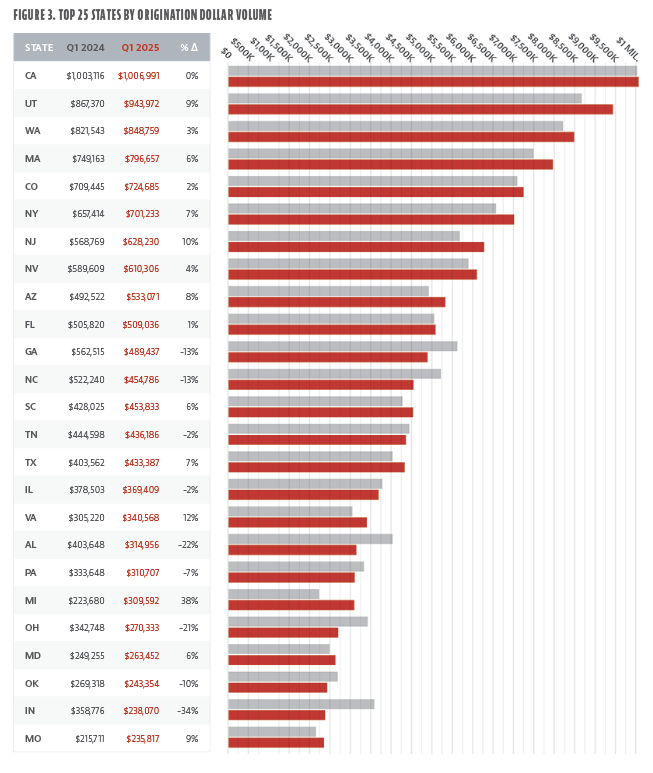
First, nine states saw a decrease in average mortgage amount, and the remaining 16 states in the analysis experienced mostly single-digit increases. Second, the states with the largest contractions were Indiana, Alabama, Ohio, North Carolina, and Georgia. Third, the states with the largest growth were Michigan, Virginia, and New Jersey.
Among the top 50 MSAs by total originations, the following 10 saw the largest increase in private lending originations compared to the same period last year:
Kansas City, MO-KS Metro Area (68%)
Birmingham, AL Metro Area (56%)
Cleveland, OH Metro Area (55%)
San Jose-Sunnyvale-Santa Clara, CA Metro Area (52%)
Richmond, VA Metro Area (49%)
Columbia, SC Metro Area (43%)
Detroit-Warren-Dearborn, MI Metro Area (42%)
Oklahoma City, OK Metro Area (40%)
Tampa-St. Petersburg-Clearwater, FL Metro Area (40%)
Greenville-Anderson-Greer, SC Metro Area (38%)
Despite the growth across the board, there remained some areas that underperformed relative to first-quarter 2024. Among the top 50 MSAs, the following are the only ones to see a decline in private lending originations compared to the same period last year:
Sacramento-Roseville-Folsom, CA Metro Area (-32%)
San Francisco-Oakland-Fremont, CA Metro Area (-24%)
Chicago-Naperville-Elgin, IL-IN Metro Area (-19%)
Pittsburgh, PA Metro Area (-15%)
Cape Coral-Fort Myers, FL Metro Area (-14%)
Boston-Cambridge-Newton, MA-NH Metro Area (-6%)
San Antonio-New Braunfels, TX Metro Area (-2%)
Austin-Round Rock-San Marcos, TX Metro Area (-1%)
McAllen-Edinburg-Mission, TX Metro Area (-1%)
Lender Landscape
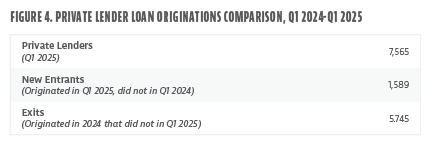
In 2025, 7,565 private lenders originated a loan in the first quarter. This is a more than 20% increase from first-quarter 2024. There are still 5,754 private lenders that have yet to originate a loan in 2025 that originated in 2024—this can be thought of as potential “exits.” (see Fig. 4).
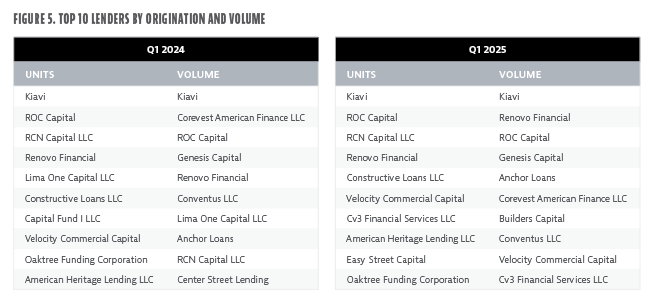
There was a slight consolidation at the top of the market: The top 10 private lenders by originations made up 25% of the market, compared to 22% in the first quarter of last year. Seven of the top 10 private lenders experienced double-digit growth YOY. Generally, the top players have remained the same since last year, but there are some new large players that have seen a significant increase in market share. Cv3 Financial Services, just over one year into starting their business, is solidifying themselves as a Top 10 lender in the space, nearly doubling their originations in comparison to the first quarter of last year (see Fig. 5).
Private Loan Buyers
Compared to first-quarter 2024, there was an increase in private lending loans bought, but there was a consolidation in the number of buyers in the market. There was a 5% increase in loans bought, and a 20% decrease in the number of loan buyers in the market. Although the number of loan buyers has contracted, Forecasa did not identify any material loan buyers exiting the market.
Negative Remark Growth
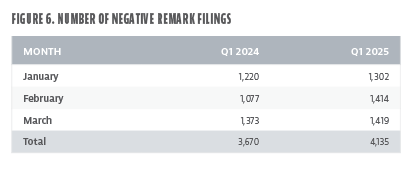
Although originations have increased, negative remark filings have increased as well compared to first-quarter 2024. Negative remarks are any type of pre-foreclosure filing (e.g., lis pendens, notice of trustee sale, notice of foreclosure, etc.). Figure 6 shows the number of negative remark filings with a private lender, first-quarter 2025 compared to first-quarter 2024. Although the lender is not always listed on negative remark filings due to loans being bought and sold on the secondary market, these filings can be used as a proxy for describing the market.
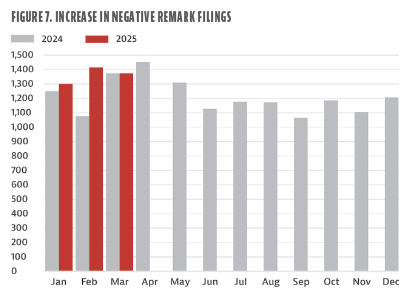
There were more negative remark filings with a private lender in first-quarter 2025 than in any quarter in 2024. There was an increase of 13% from first-quarter 2024 and an increase of 18% from fourth-quarter 2024 (see Fig. 7).
Forecasa not only tracks negative remark transactions but also identifies the negative remark borrowers. As of May 2025, Forecasa has identified more than 6,200 private lending borrowers who have had a negative remark filed against them by either a private lender or a private loan buyer. This population of borrowers continues to update and expand daily.
Conclusion
Private lending in first-quarter 2025 saw strong momentum, driven by both higher origination volumes and a growing lender base. Origination units rose 13% year-over-year, with total volume surpassing $33.2 billion.


Leave A Comment