
Driven by strong secondary market conditions, bridge and DSCR loan originations grew rapidly in 2024, setting the stage for continued momentum in 2025.
During the last six years, Lightning Docs, a platform built for private lenders to generate their short-term (bridge, fix-and-flip, construction, etc.) and long term rental (DSCR) loan documents and the official loan documents of the American Association of Private Lenders, has been used for more than 92,000 loans totaling over $49 billion in loan origination, including usage by more than half of the nation’s top 50 private lenders. In January 2025, there were a total of 4,272 loan transactions totaling more than $2 billion in origination. All the transactions are done by private lenders, providing unique transparency for an industry that tends to be opaque.
This article provides private lenders with data-driven insights, including competitive benchmarking analysis to understand meaningful trends in private lending activity to make sure your business retains its competitive edge in an evolving marketplace.
Definitions and Methodology
A bridge loan is any loan with a duration of 36 months or less utilizing interest-only payments for the duration of the term and containing a balloon payment at the end of the loan. Bridge loans are commonly referred to as residential transition loans, fix-and-flip, non-owner occupied, hard money, or in other terms that describe a short-term loan generally secured by a residential property for investment purposes.
In 2024, Lightning Docs users generated more than 20,000 bridge loans. Although bridge loans are generally considered to be for construction purposes, a full 38% of bridge loans generated in 2024 did not contain any holdback or reserves for construction.
DSCR loans are 30-year term loans secured by rental properties. DSCR stands for Debt Service Coverage Ratio, which identifies that the primary underwriting for these loans is done by dividing the monthly net operating income of the property by the monthly debt service.
In 2024, Lightning Docs users generated more than 17,000 DSCR loans across 50 unique private lenders.
Expansive Growth in Bridge and DSCR
In 2024 we witnessed a dynamic shift in business-purpose lending.
According to data aggregator Forecasa, the top 100 private lenders in the United States increased their loan volumes by 25.3% in 2024 (increasing by approximately 27,000 total loan transactions year-over-year for a total of more than 133,000 loan transactions). Twenty-two percent of the top private lenders’ volumes decreased year-over-year, while the remaining 78% increased.
Lightning Docs users experienced a dramatic growth of 31% year-over-year increase in bridge loan volumes, driven by favorable secondary market conditions.
DSCR loan volume, on the other hand, increased an incredible 52% year over year across all Lightning Docs users, with dramatic growth in the third and fourth quarters, reflecting the resilience of the product even in uncertain economic conditions.
As we moved into January 2025, a typically slow month for our industry, these trends surprisingly continued. Bridge loan volumes increased 51% year over year when comparing January 2024 to January 2025—and an astounding 123% for DSCR loans during the same time period.
Bridge loan Analysis
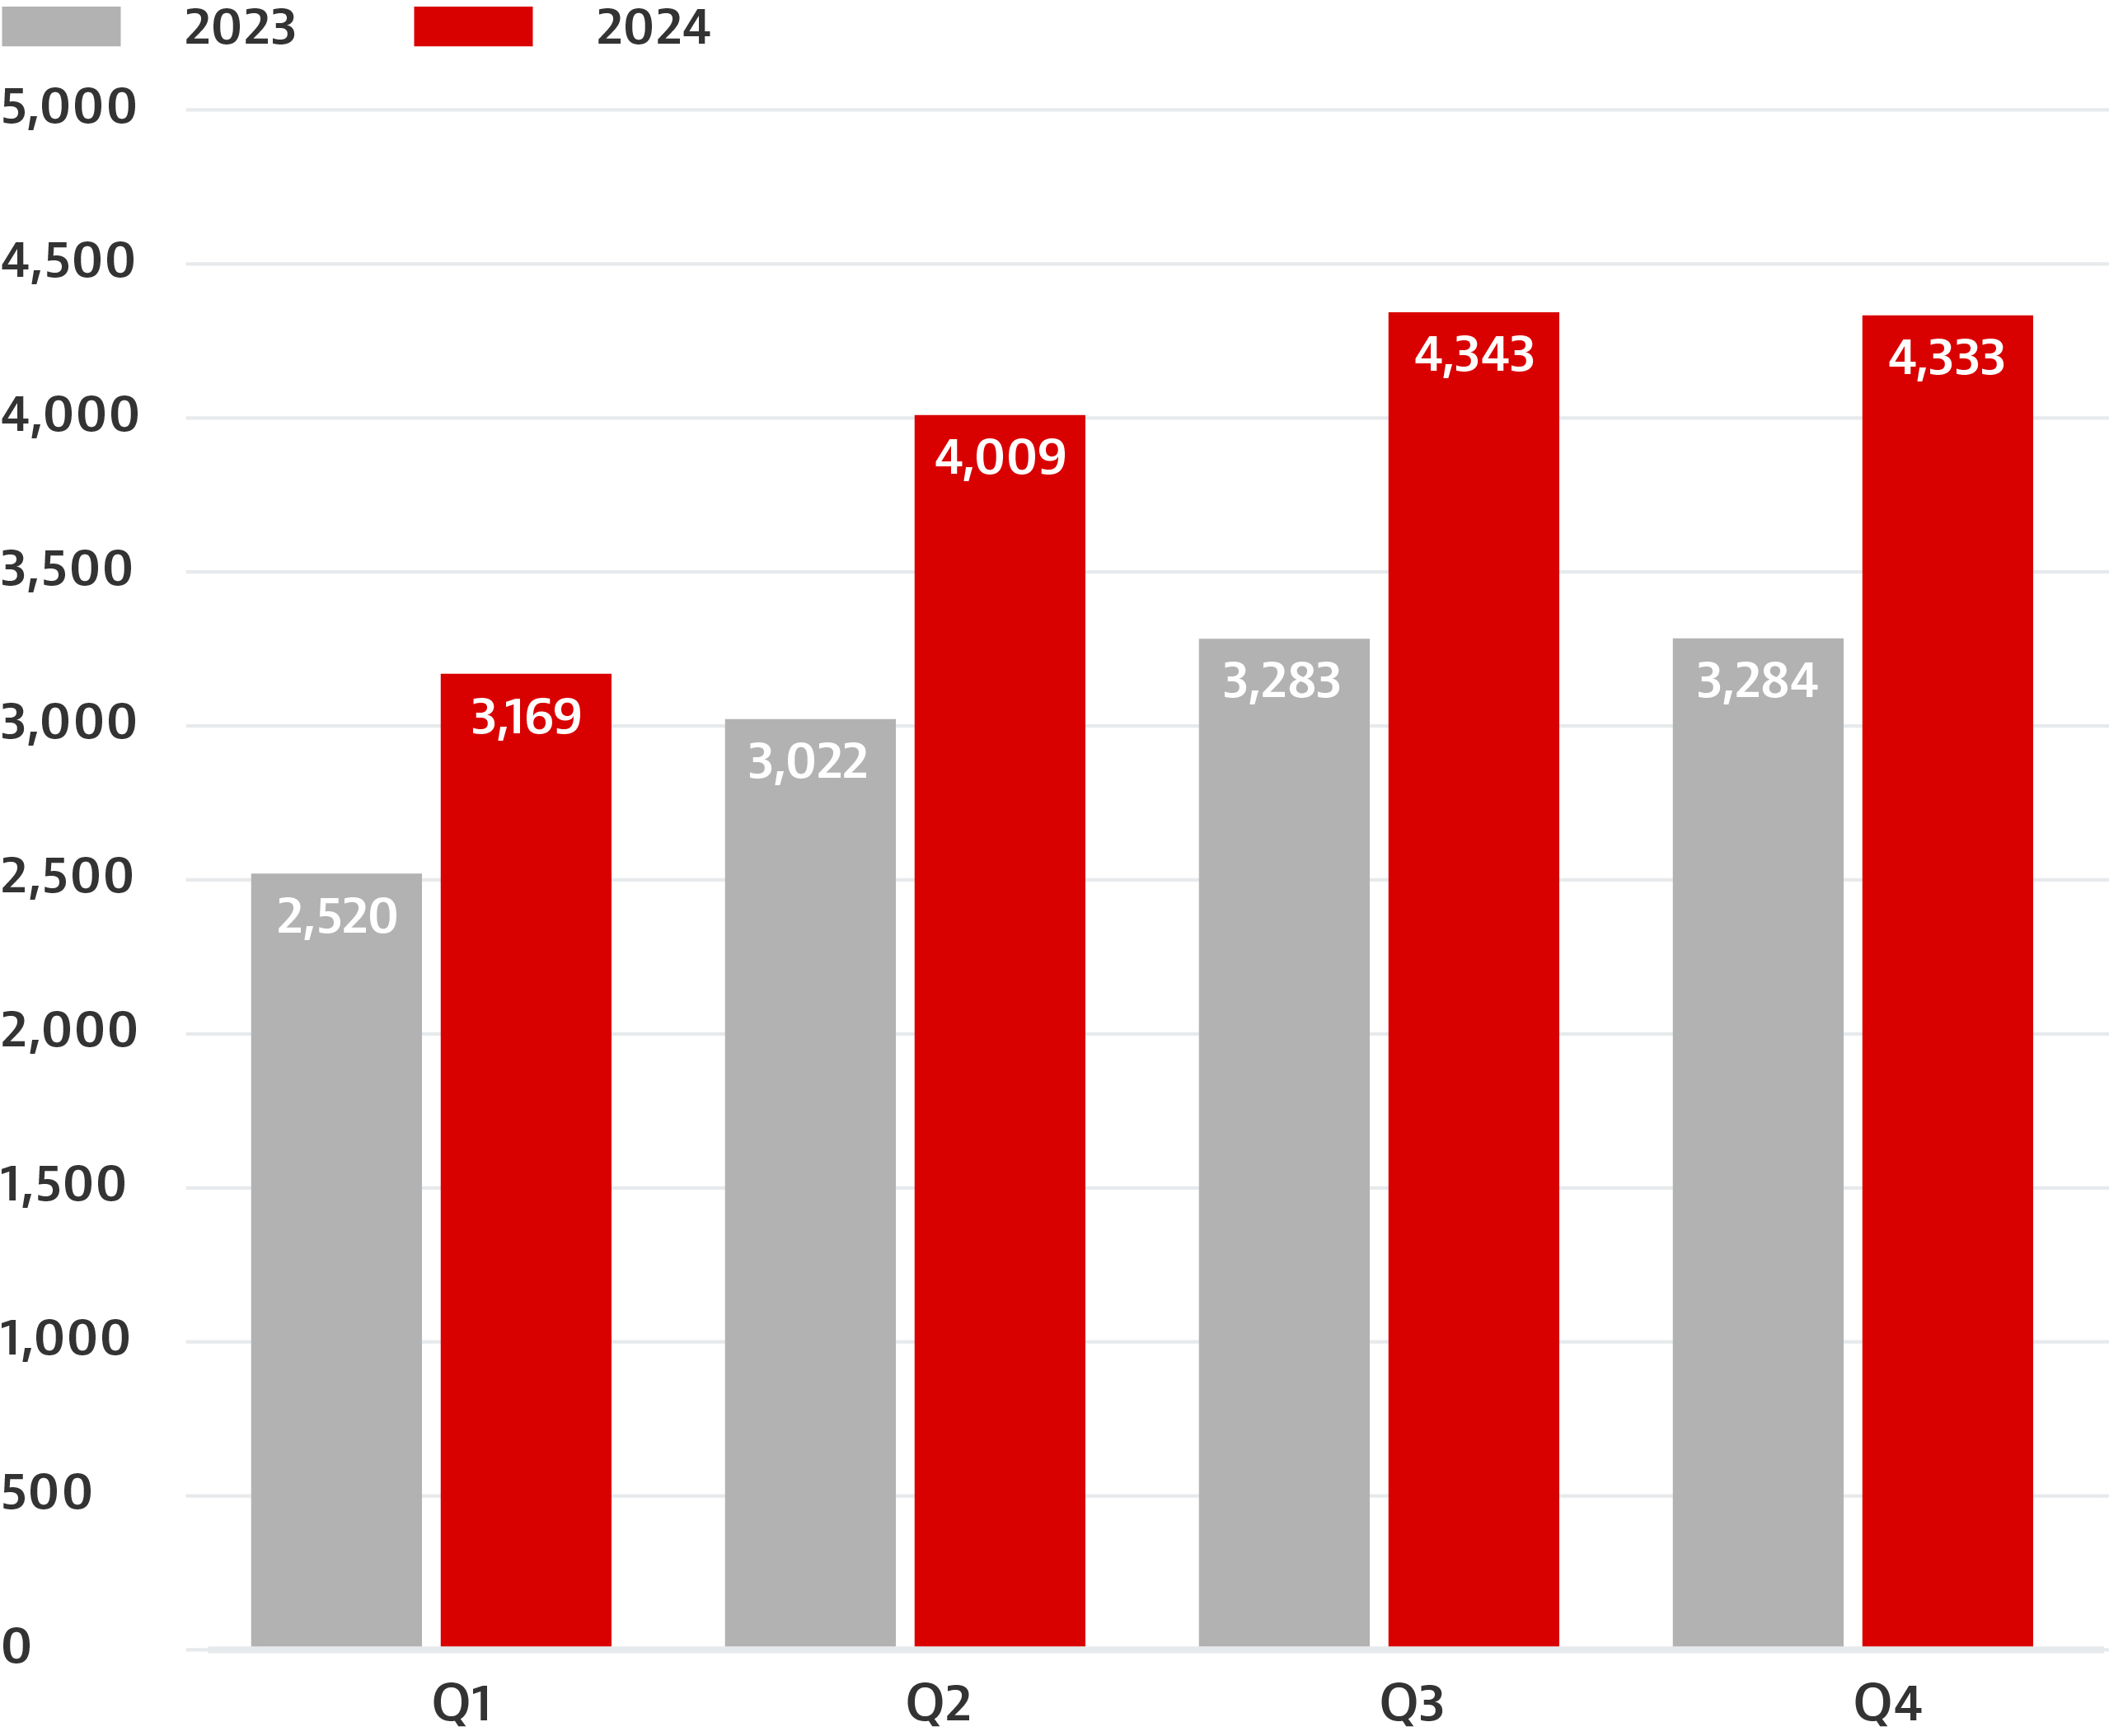
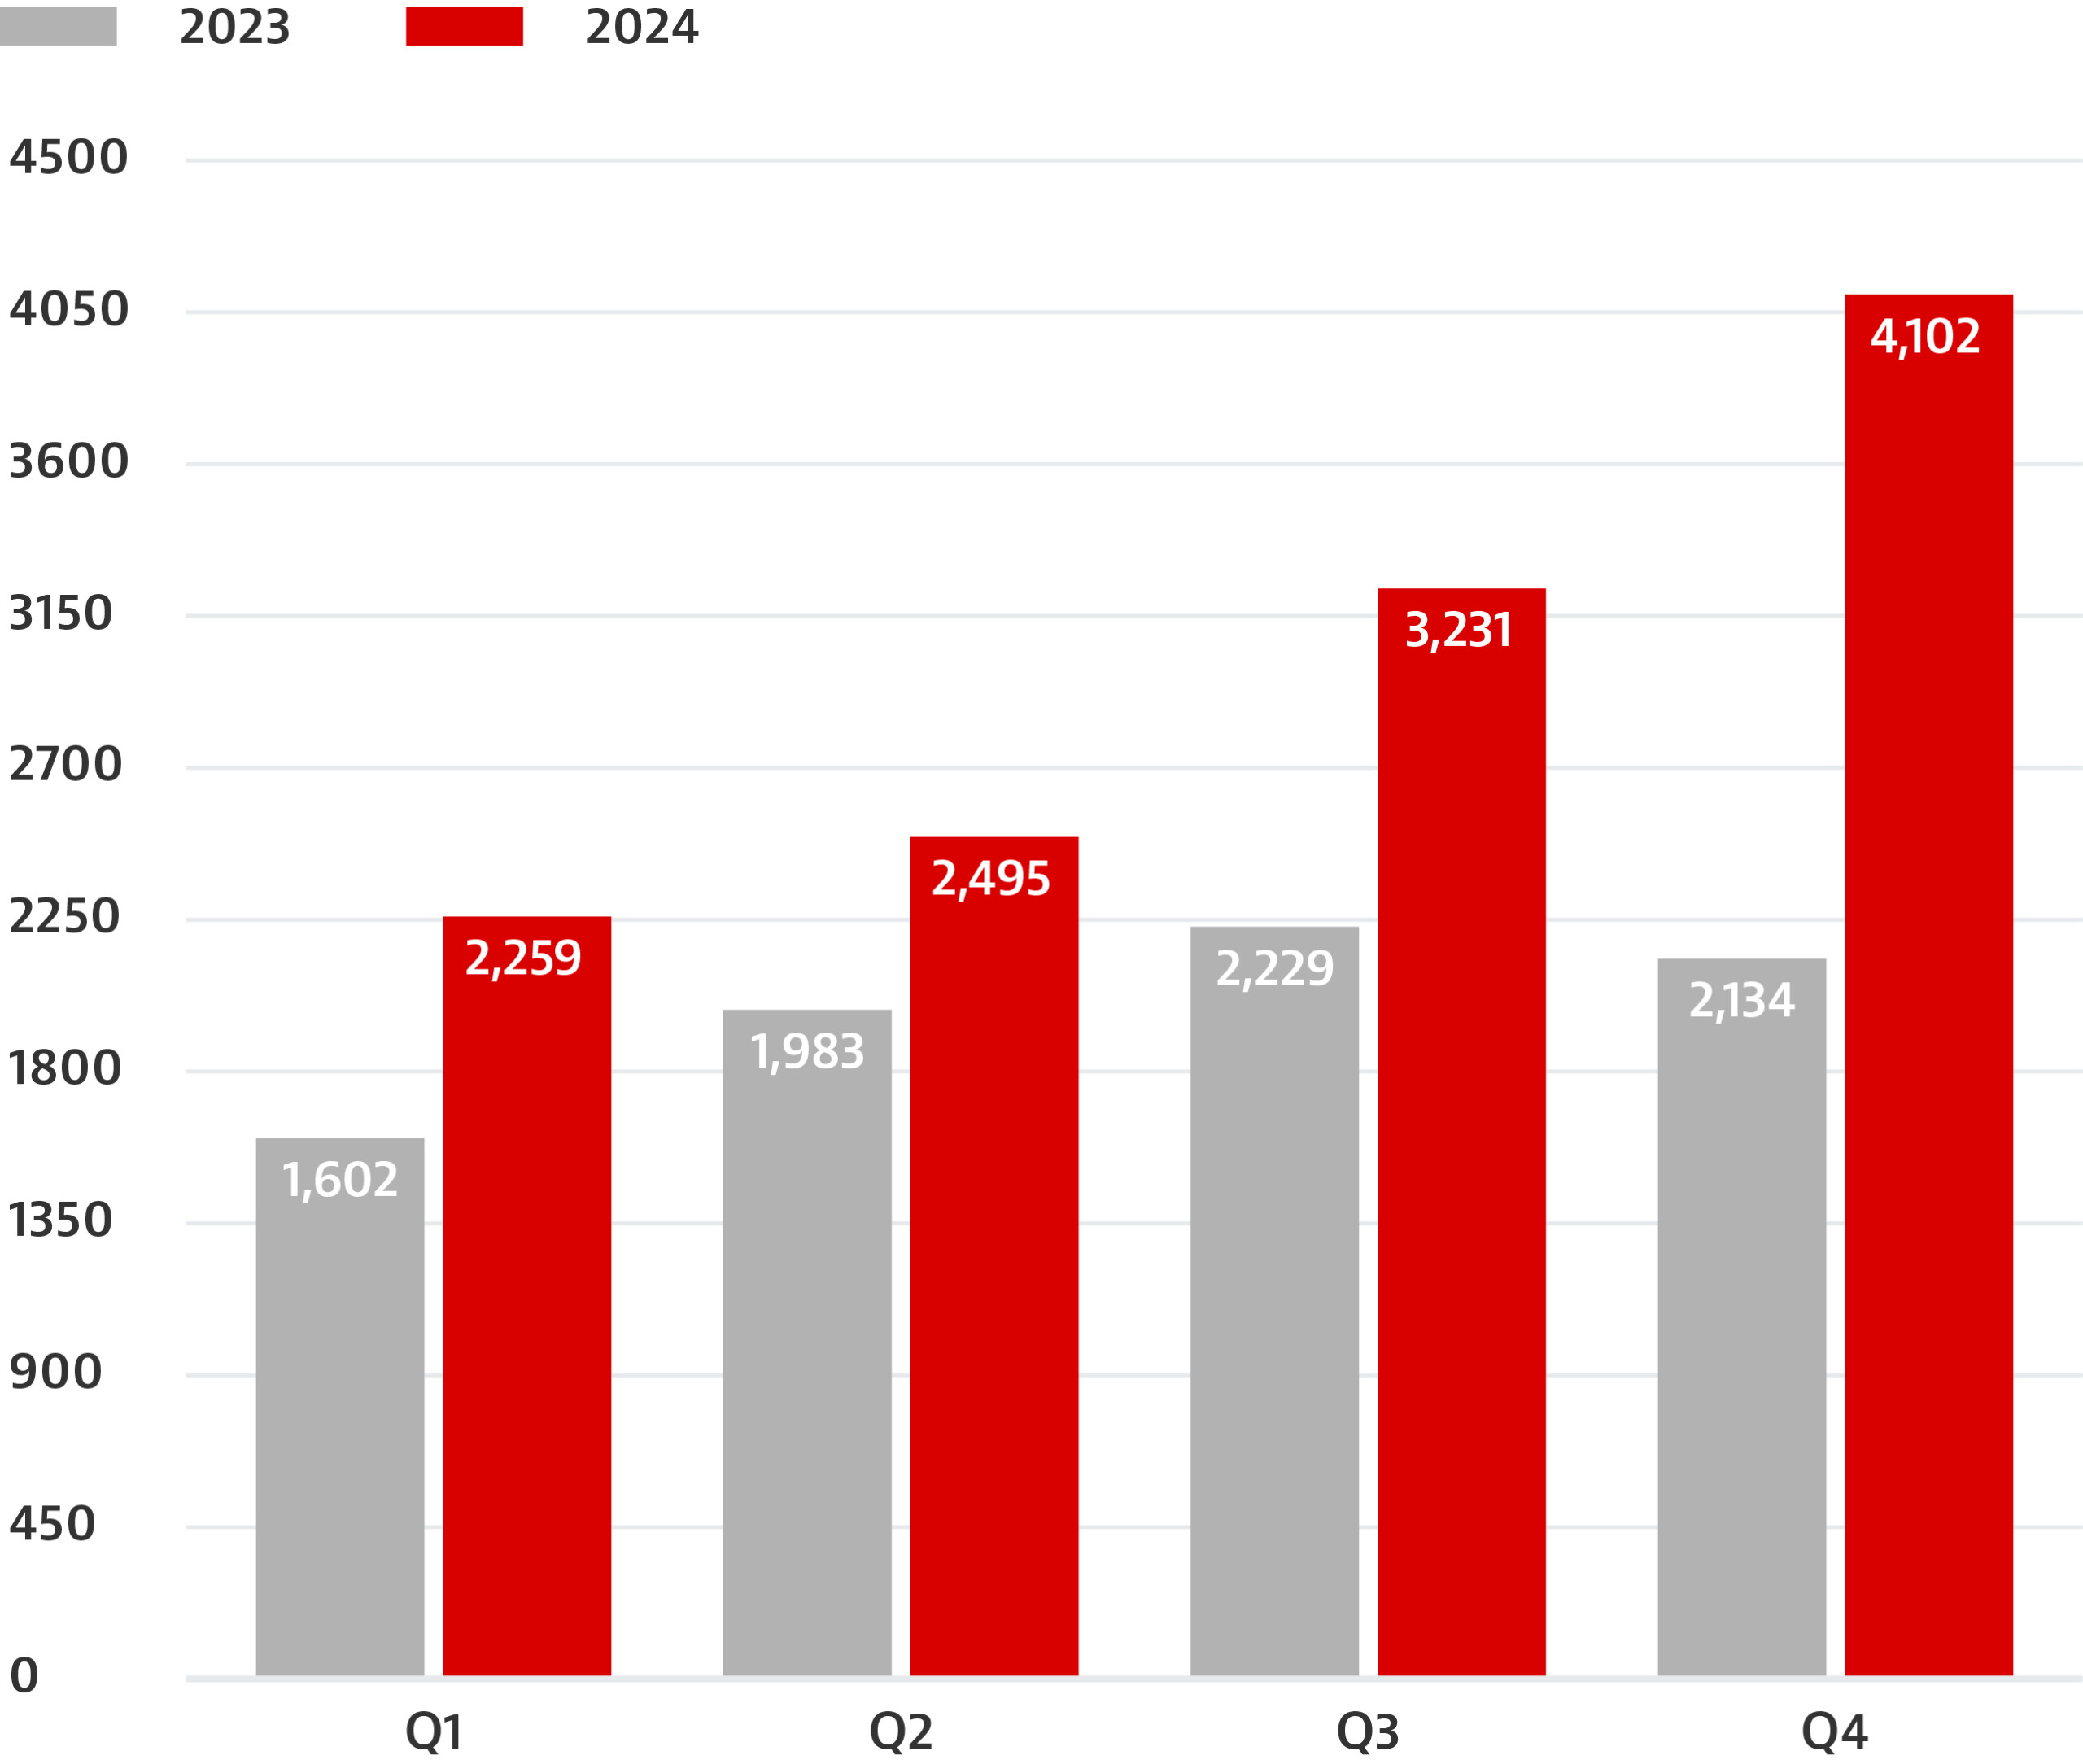
Loan Volumes. When tracking the same 125 users who started using the system to make bridge loans on or prior to January 1, 2023 through December 31, 2024, there was an uptick of 31% year-over-year growth. The first quarter saw the softest growth, with a 25% year-over-year increase; the remaining quarters saw consistent growth from 31-33% (see Fig. 1).
Figure 1. Year-Over-Year Analysis of Bridge Loan Volumes
Interest Rates and Loan Amounts. Bridge loan interest rates decreased for the eighth time in the last nine months, dropping 73 basis points since January of last year. The revival of the 2024 loan securitization market, including the first rated loan securitizations, is widely credited for the reduction in interest rates. Average loan amounts increased from $583,060 in January 2024 to $667,527 in December, but saw them drop back down to $634,321 in early 2025.
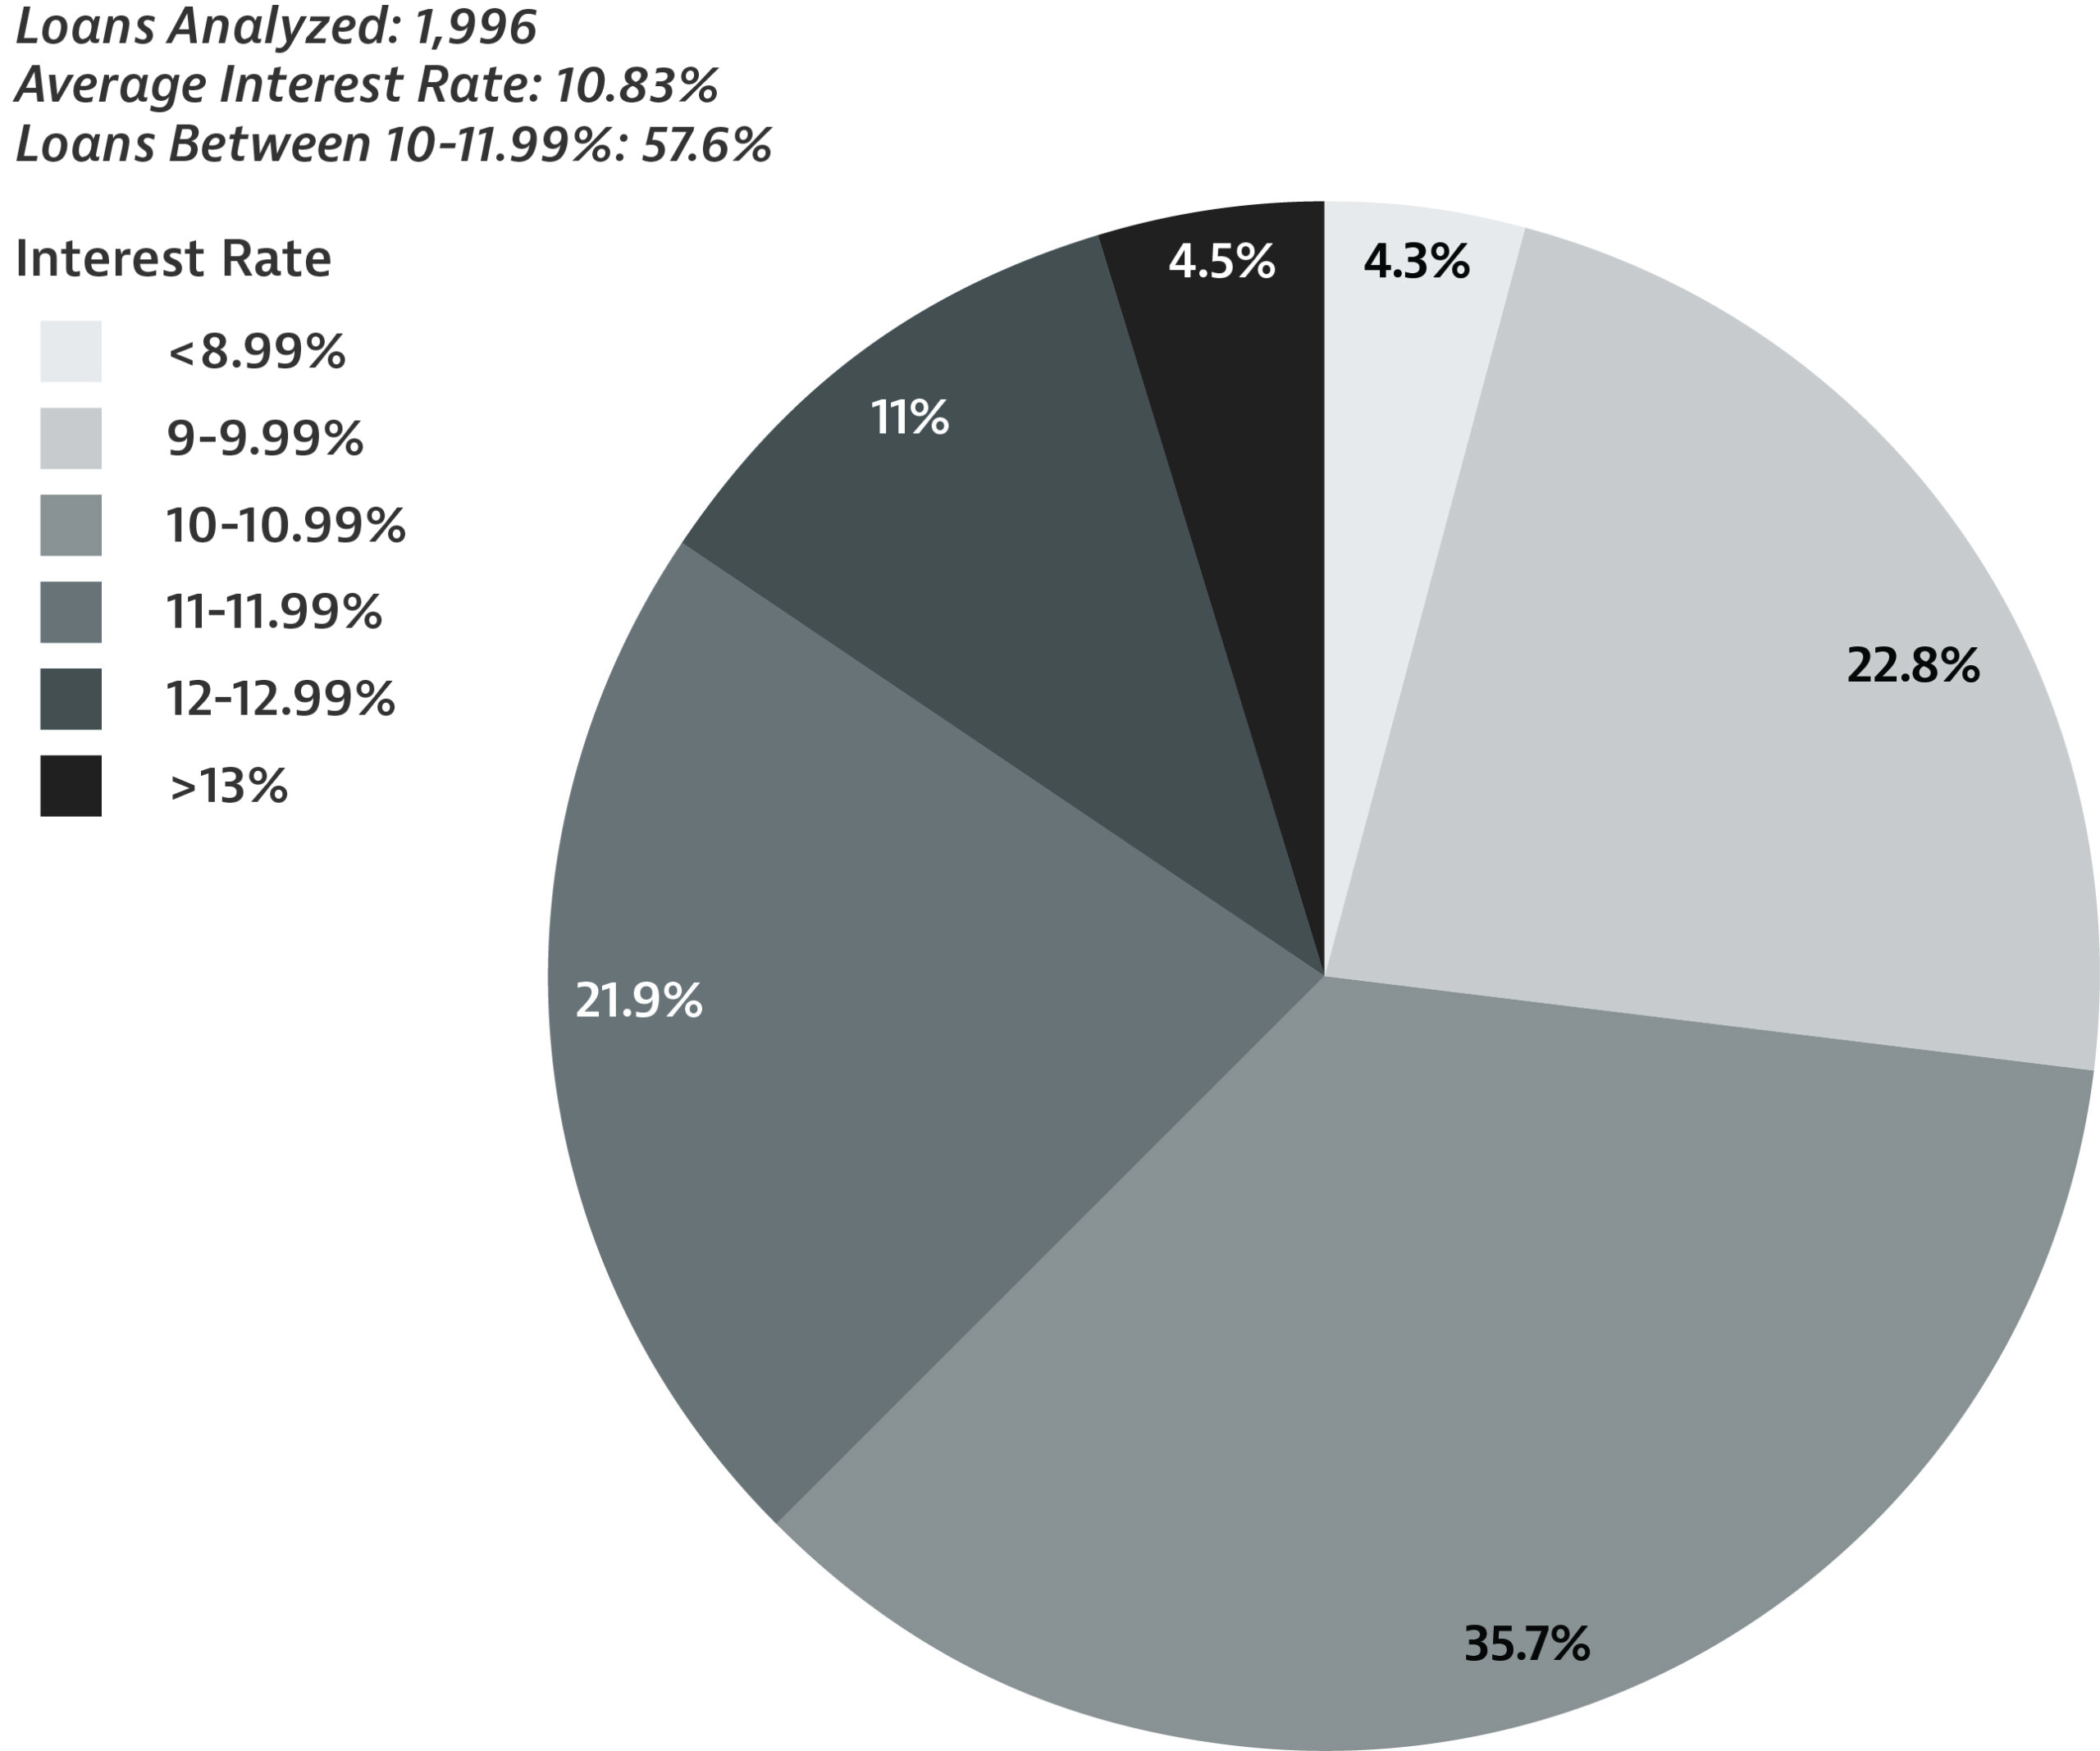
When segmenting interest rates, it becomes clear that market participants must understand their local market to make pricing determinations. For example, in January 2025, the national average interest rate for bridge loans was 10.83%. However, most interest rates varied between 9-12.99%, with only 35.7% of loans between 10-10.99% (see Fig. 2).
Figure 2. Bridge Interest Rates, January 2025
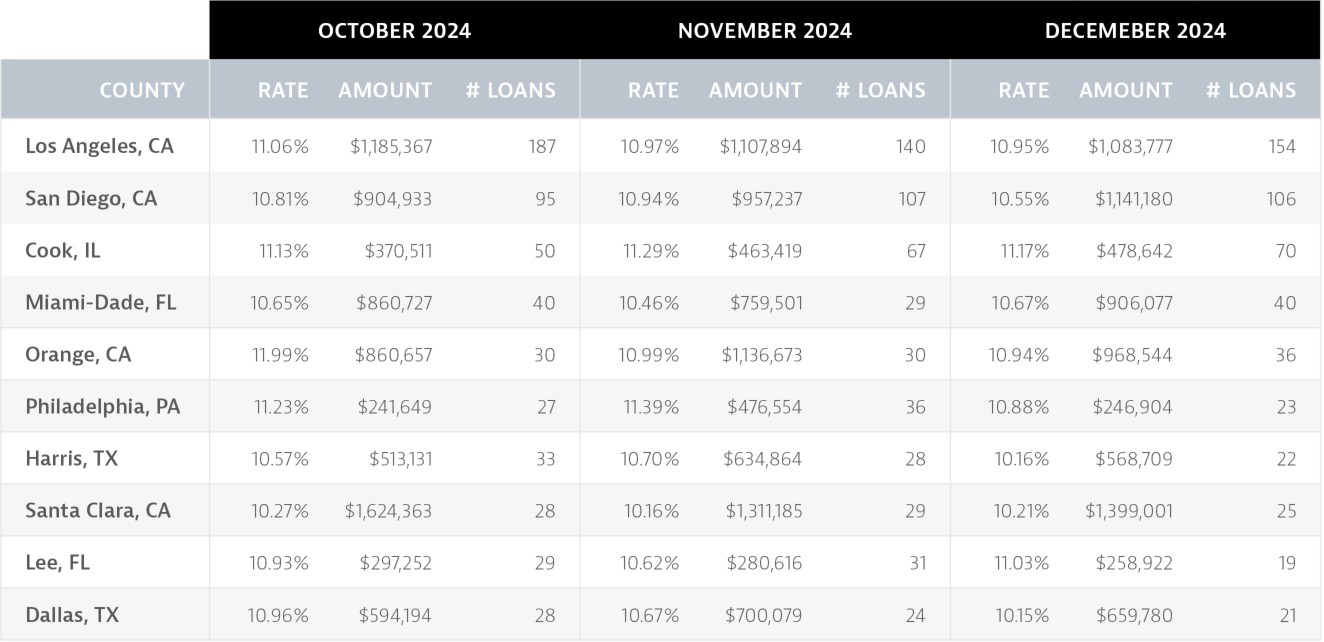
Location, Location, Location. For private lenders interested in benchmarking against their peers, the location of property is still the dominant driver determining average loan amounts and average interest rates. When reviewing the top ten bridge loan markets in the fourth quarter of 2024, you will find a full 100-basis point spread in December, based upon where the lender is making loans (see Fig. 3). Interestingly, states such as Texas consistently provide lower interest rates than markets such as California, even though the loan transaction sizes in California are generally much larger.
Figure 3. Top Bridge Market Activity
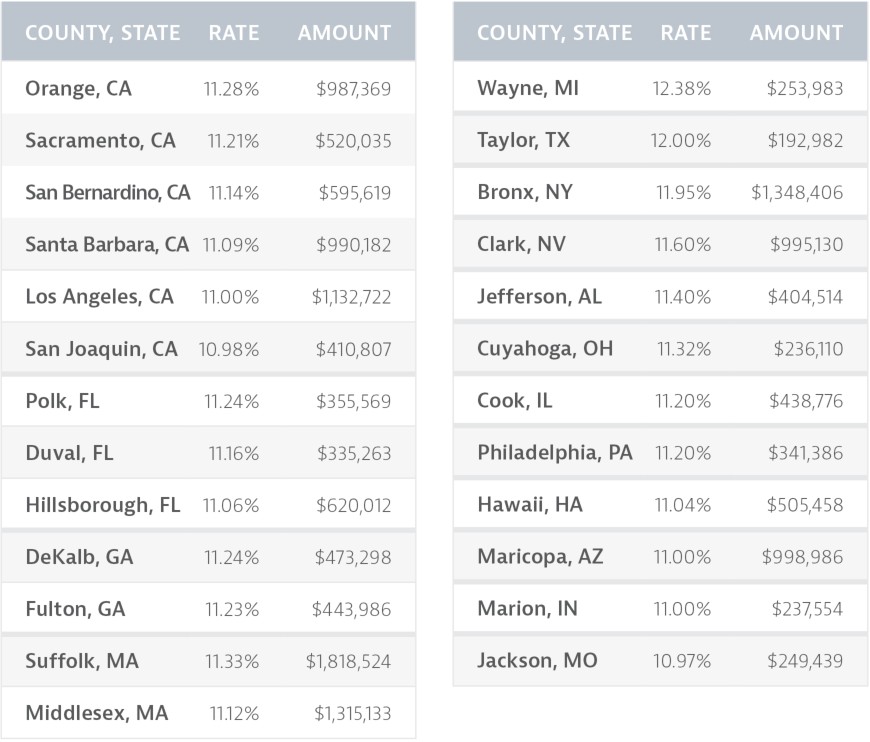
Best Interest Rate Environments. Where are the best opportunities? For those seeking the greatest rates of return, there were a total of 25 different high-volume counties that provided a better-than-average national interest rate of 10.92% in fourth quarter 2024 (see Fig. 4).
Figure 4. Counties >10.92% National Average with >20 Loans, Q4 2024
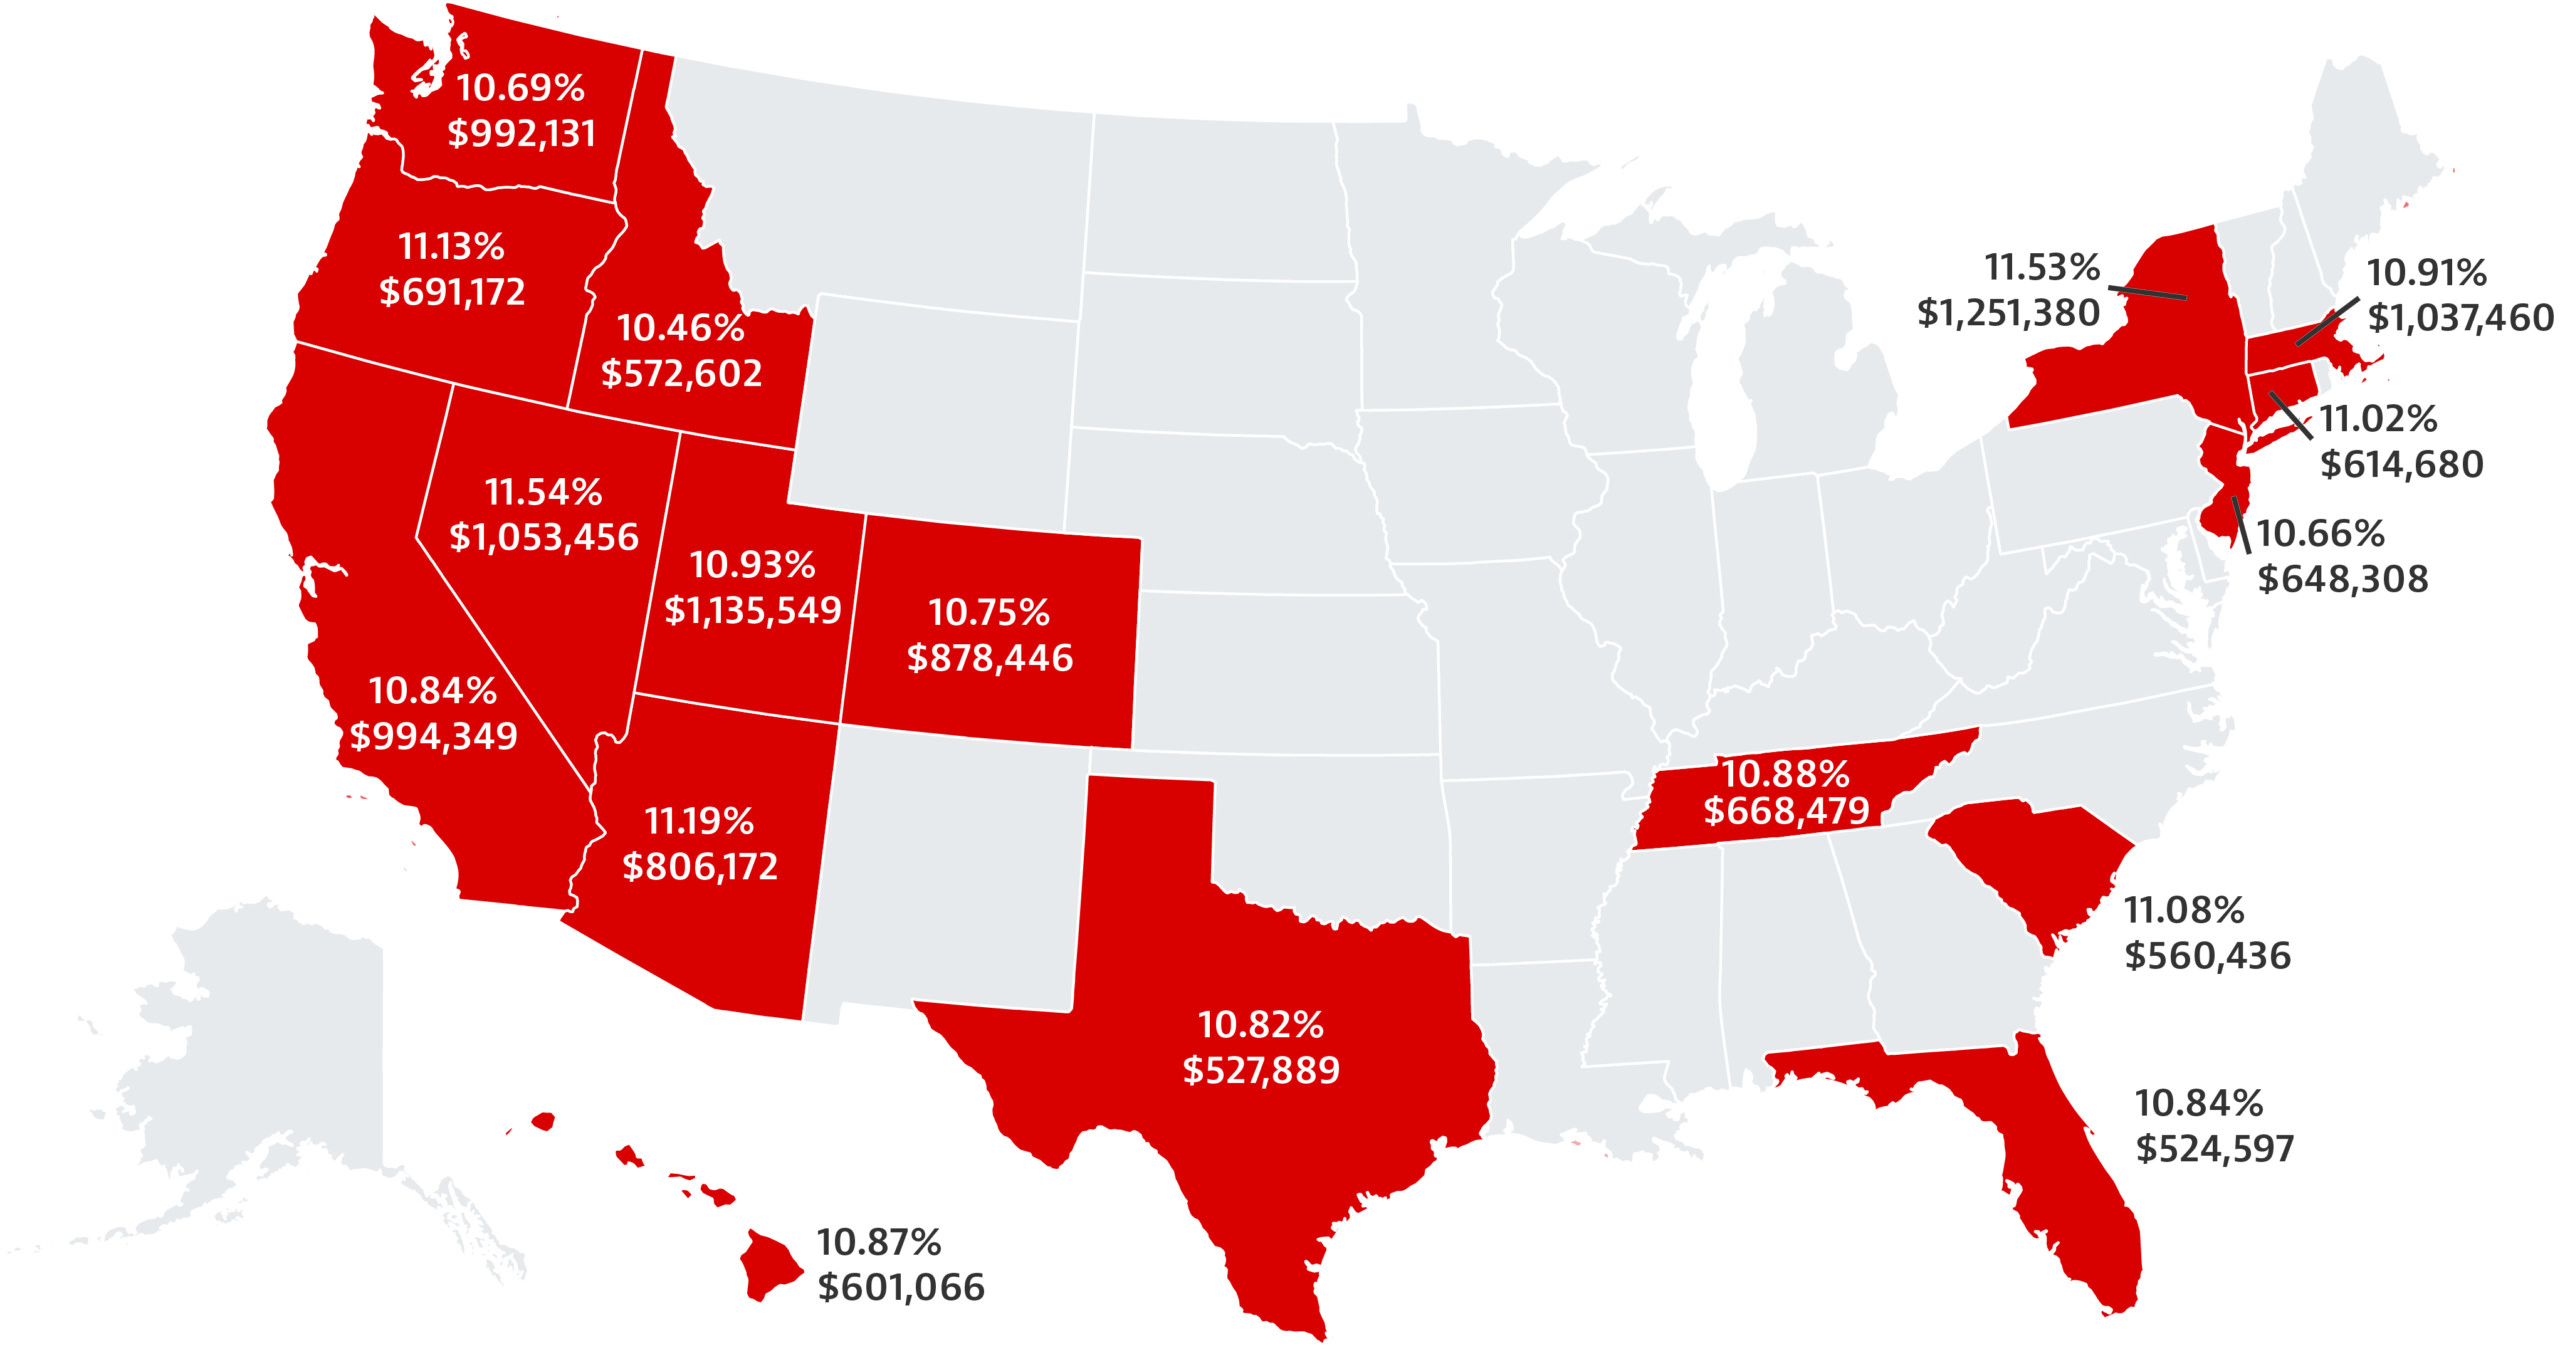
Largest Loan Balances. Because many loan originators sell their loans and their primary source of revenue is the fee income derived from loan transactions, many lenders seek states with the largest loan balances and, thus, origination fees. It’s likely no surprise these amounts are concentrated on the West coast and in the Northeast, with states such as California and Washington just shy of $1,000,000 average transaction sizes and states such as New York, Massachusetts, Nevada, and Utah all coming in above $1,000,000 on average (see Fig. 5).
Figure 5. States with Average Bridge Loan Balances Above $500K, Q4 2024
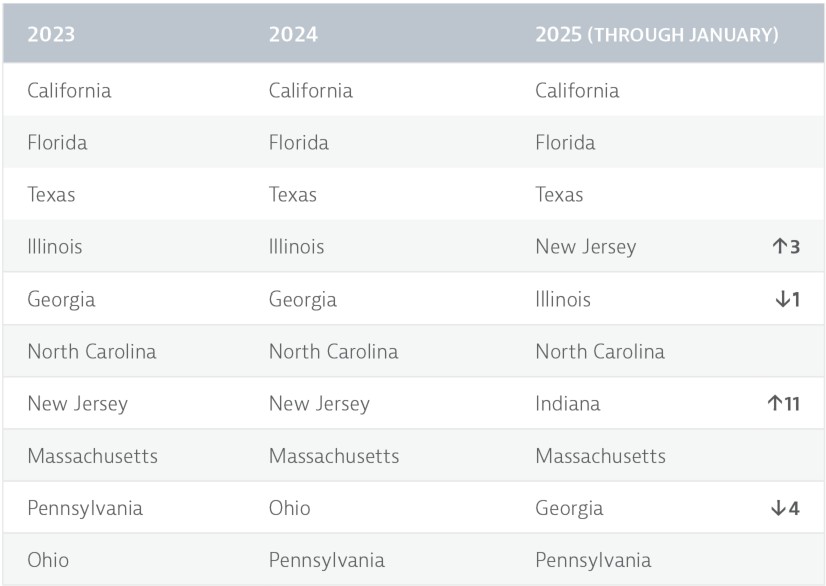
Private lenders maintained consistent focus on their top markets year over year, with the top eight states remaining unchanged from 2023 to 2024. Ohio and Pennsylvania rounded out the top ten, swapping positions between the two years.
When looking at the data from January 2025, California, Florida and Texas remain the top three with an uptick in volume in Indiana and New Jersey, while Illinois, Georgia, and Ohio dropped (see Fig. 6).
Figure 6. Top Bridge States by Volume
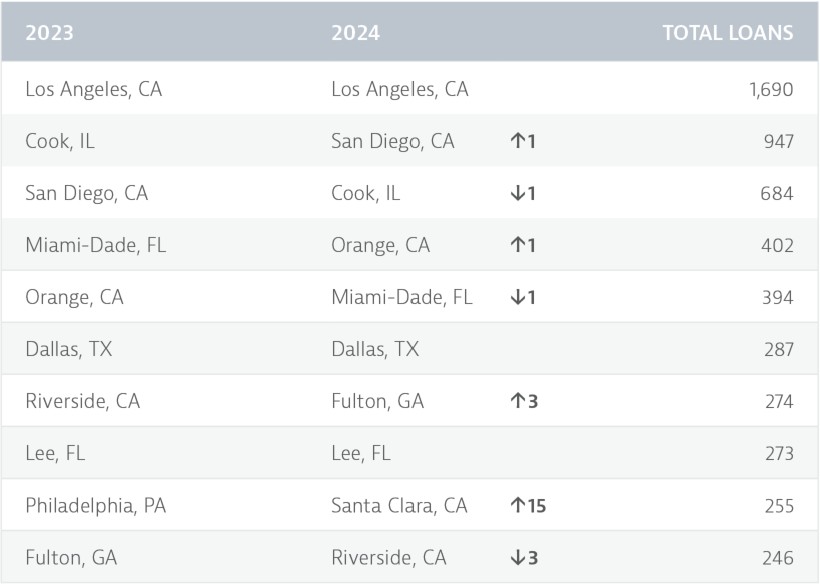
Although there was notable movement among active MSAs in 2024, the top six markets remained largely unchanged, with Los Angeles County maintaining a commanding lead. Early data from 2025 indicates that the top three markets have held steady so far (see Fig. 7).
Figure 7. Most Active Bridge Counties by Volume
DSCR Loan Analysis
Loan Volumes. When tracking the same 33 users who started using Lightning Docs to make DSCR loans on or prior to January 1, 2023 through December 31, 2024, there was a huge increase of 52% in year-over-year growth, with an astounding 92% year-over-year growth in fourth quarter 2024 (see Fig. 8).
Figure 8. Year-Over-Year Analysis of DSCR Loan Volumes
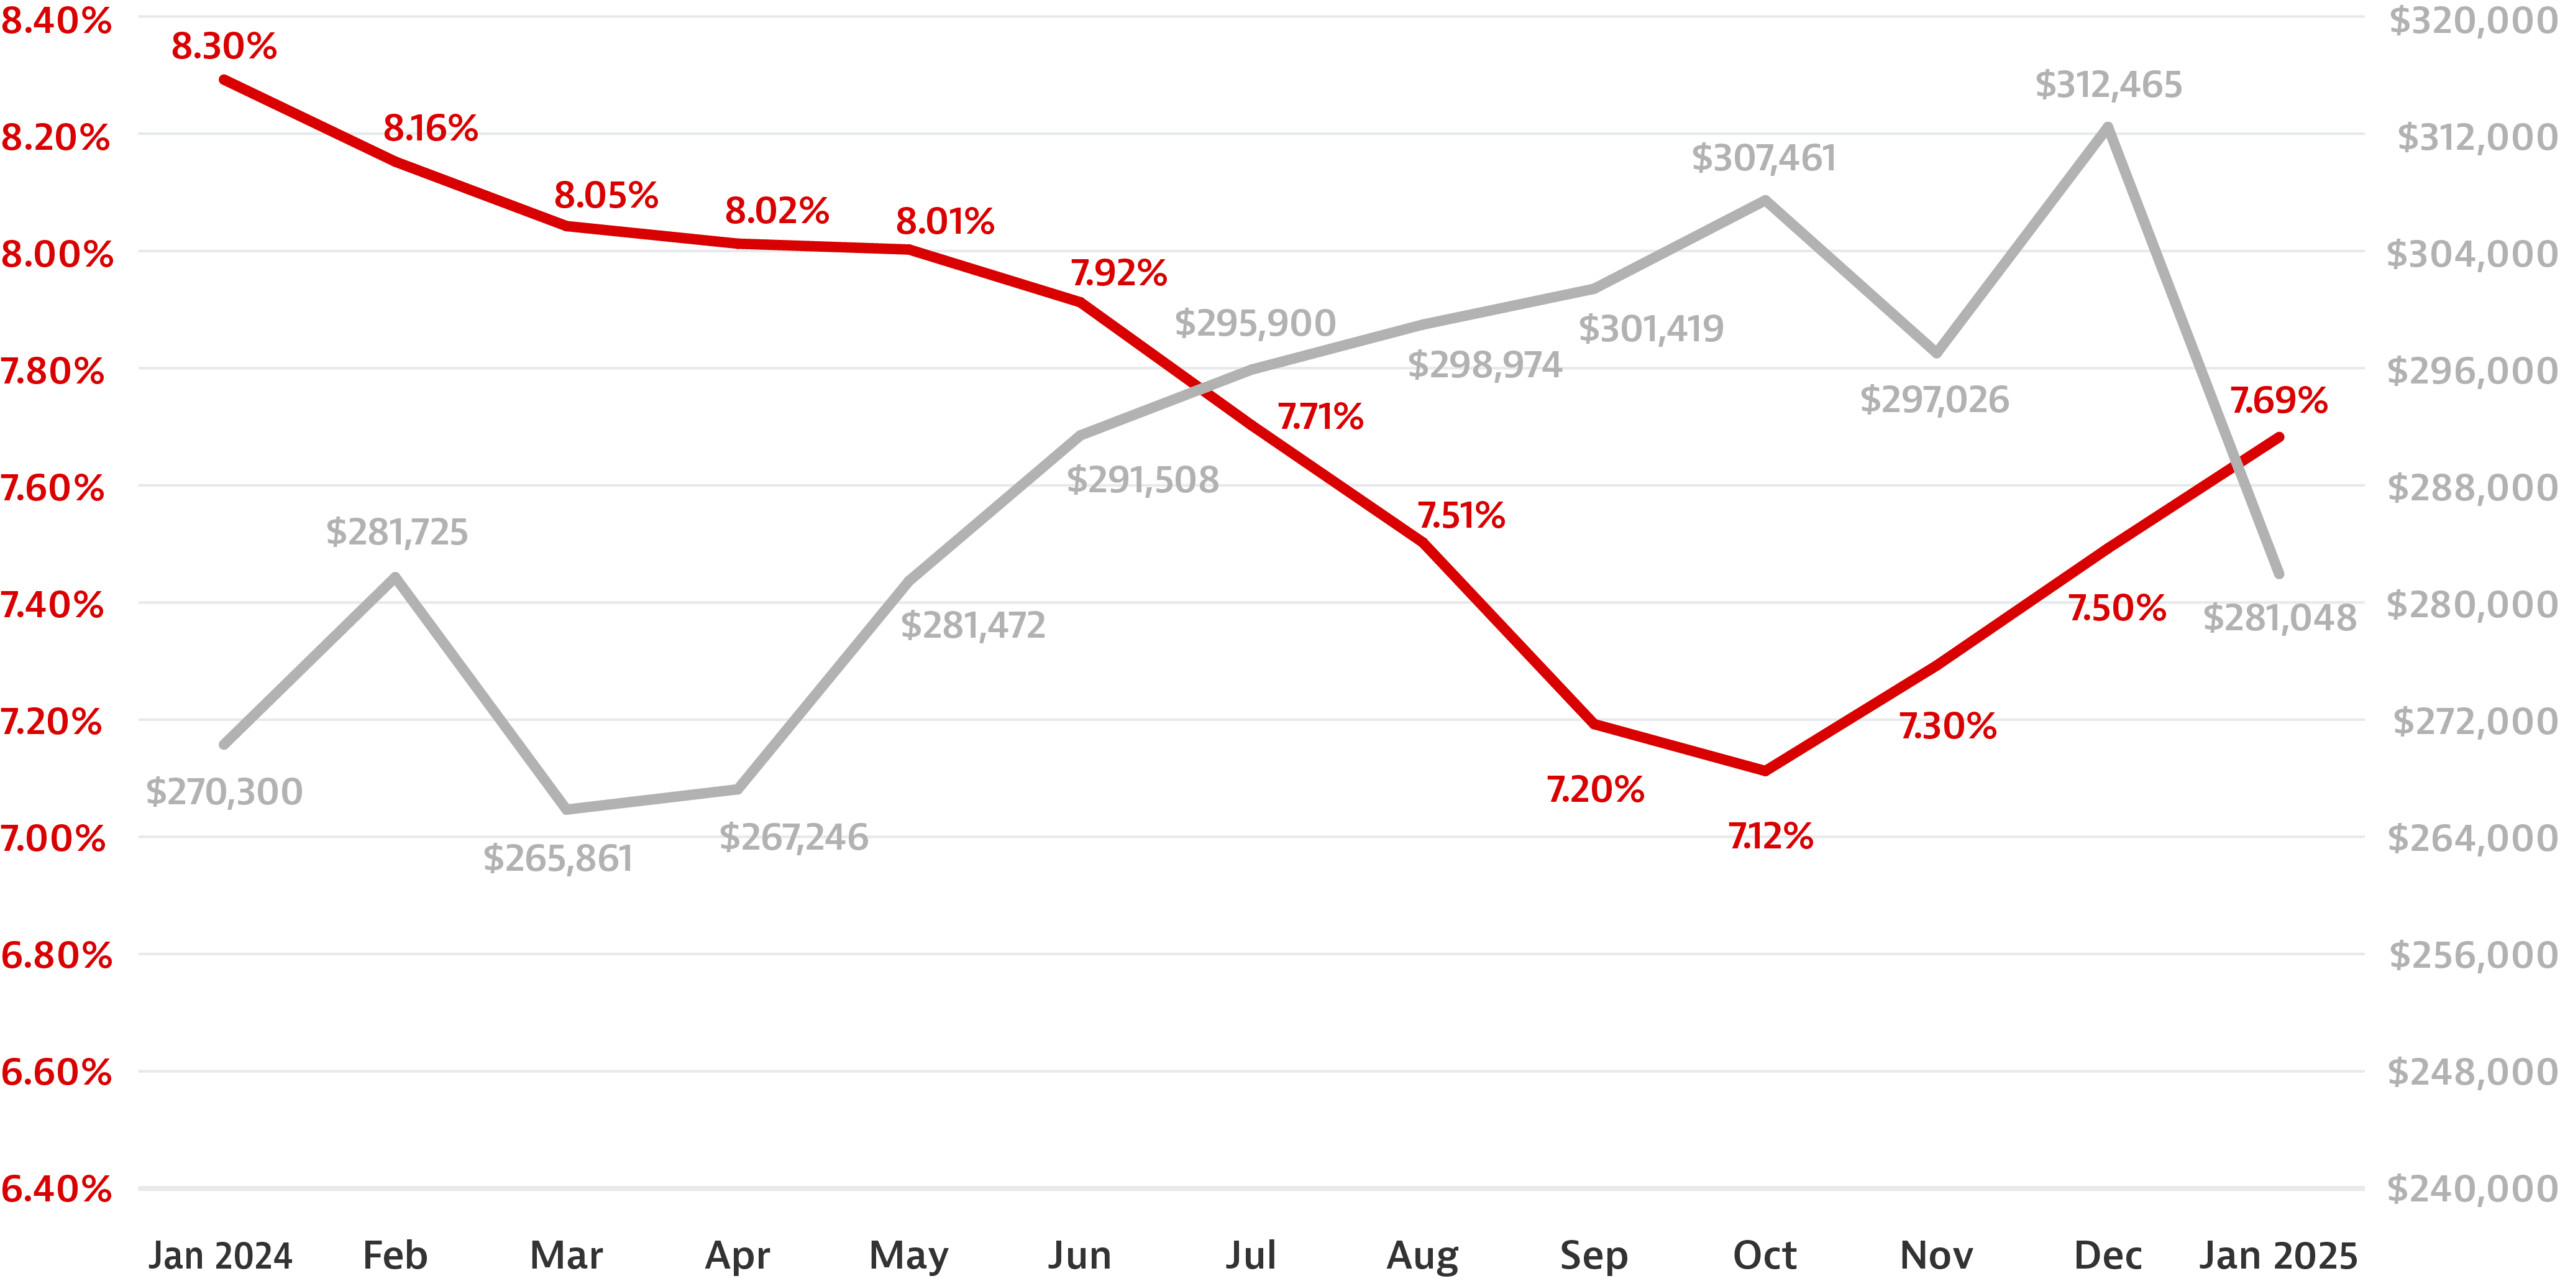
Interest Rates and Loan Amounts. DSCR interest rates increased for the third straight month in January 2025 after a steady decrease throughout the first 10 months of 2024. Like bridge loans, favorable secondary market conditions in 2024 provided an advantageous market for real estate investors as rates fell far more than typical benchmarking indexes would normally suggest.
Similar to bridge loans, DSCR loan amounts increased throughout the year from an average national loan balance of $270,300 in January to $312,465 in December; however, average volumes declined to $281,048 in January 2025 (see Fig. 9).
Figure 9. DSCR loan Rates and Average Loan Amounts
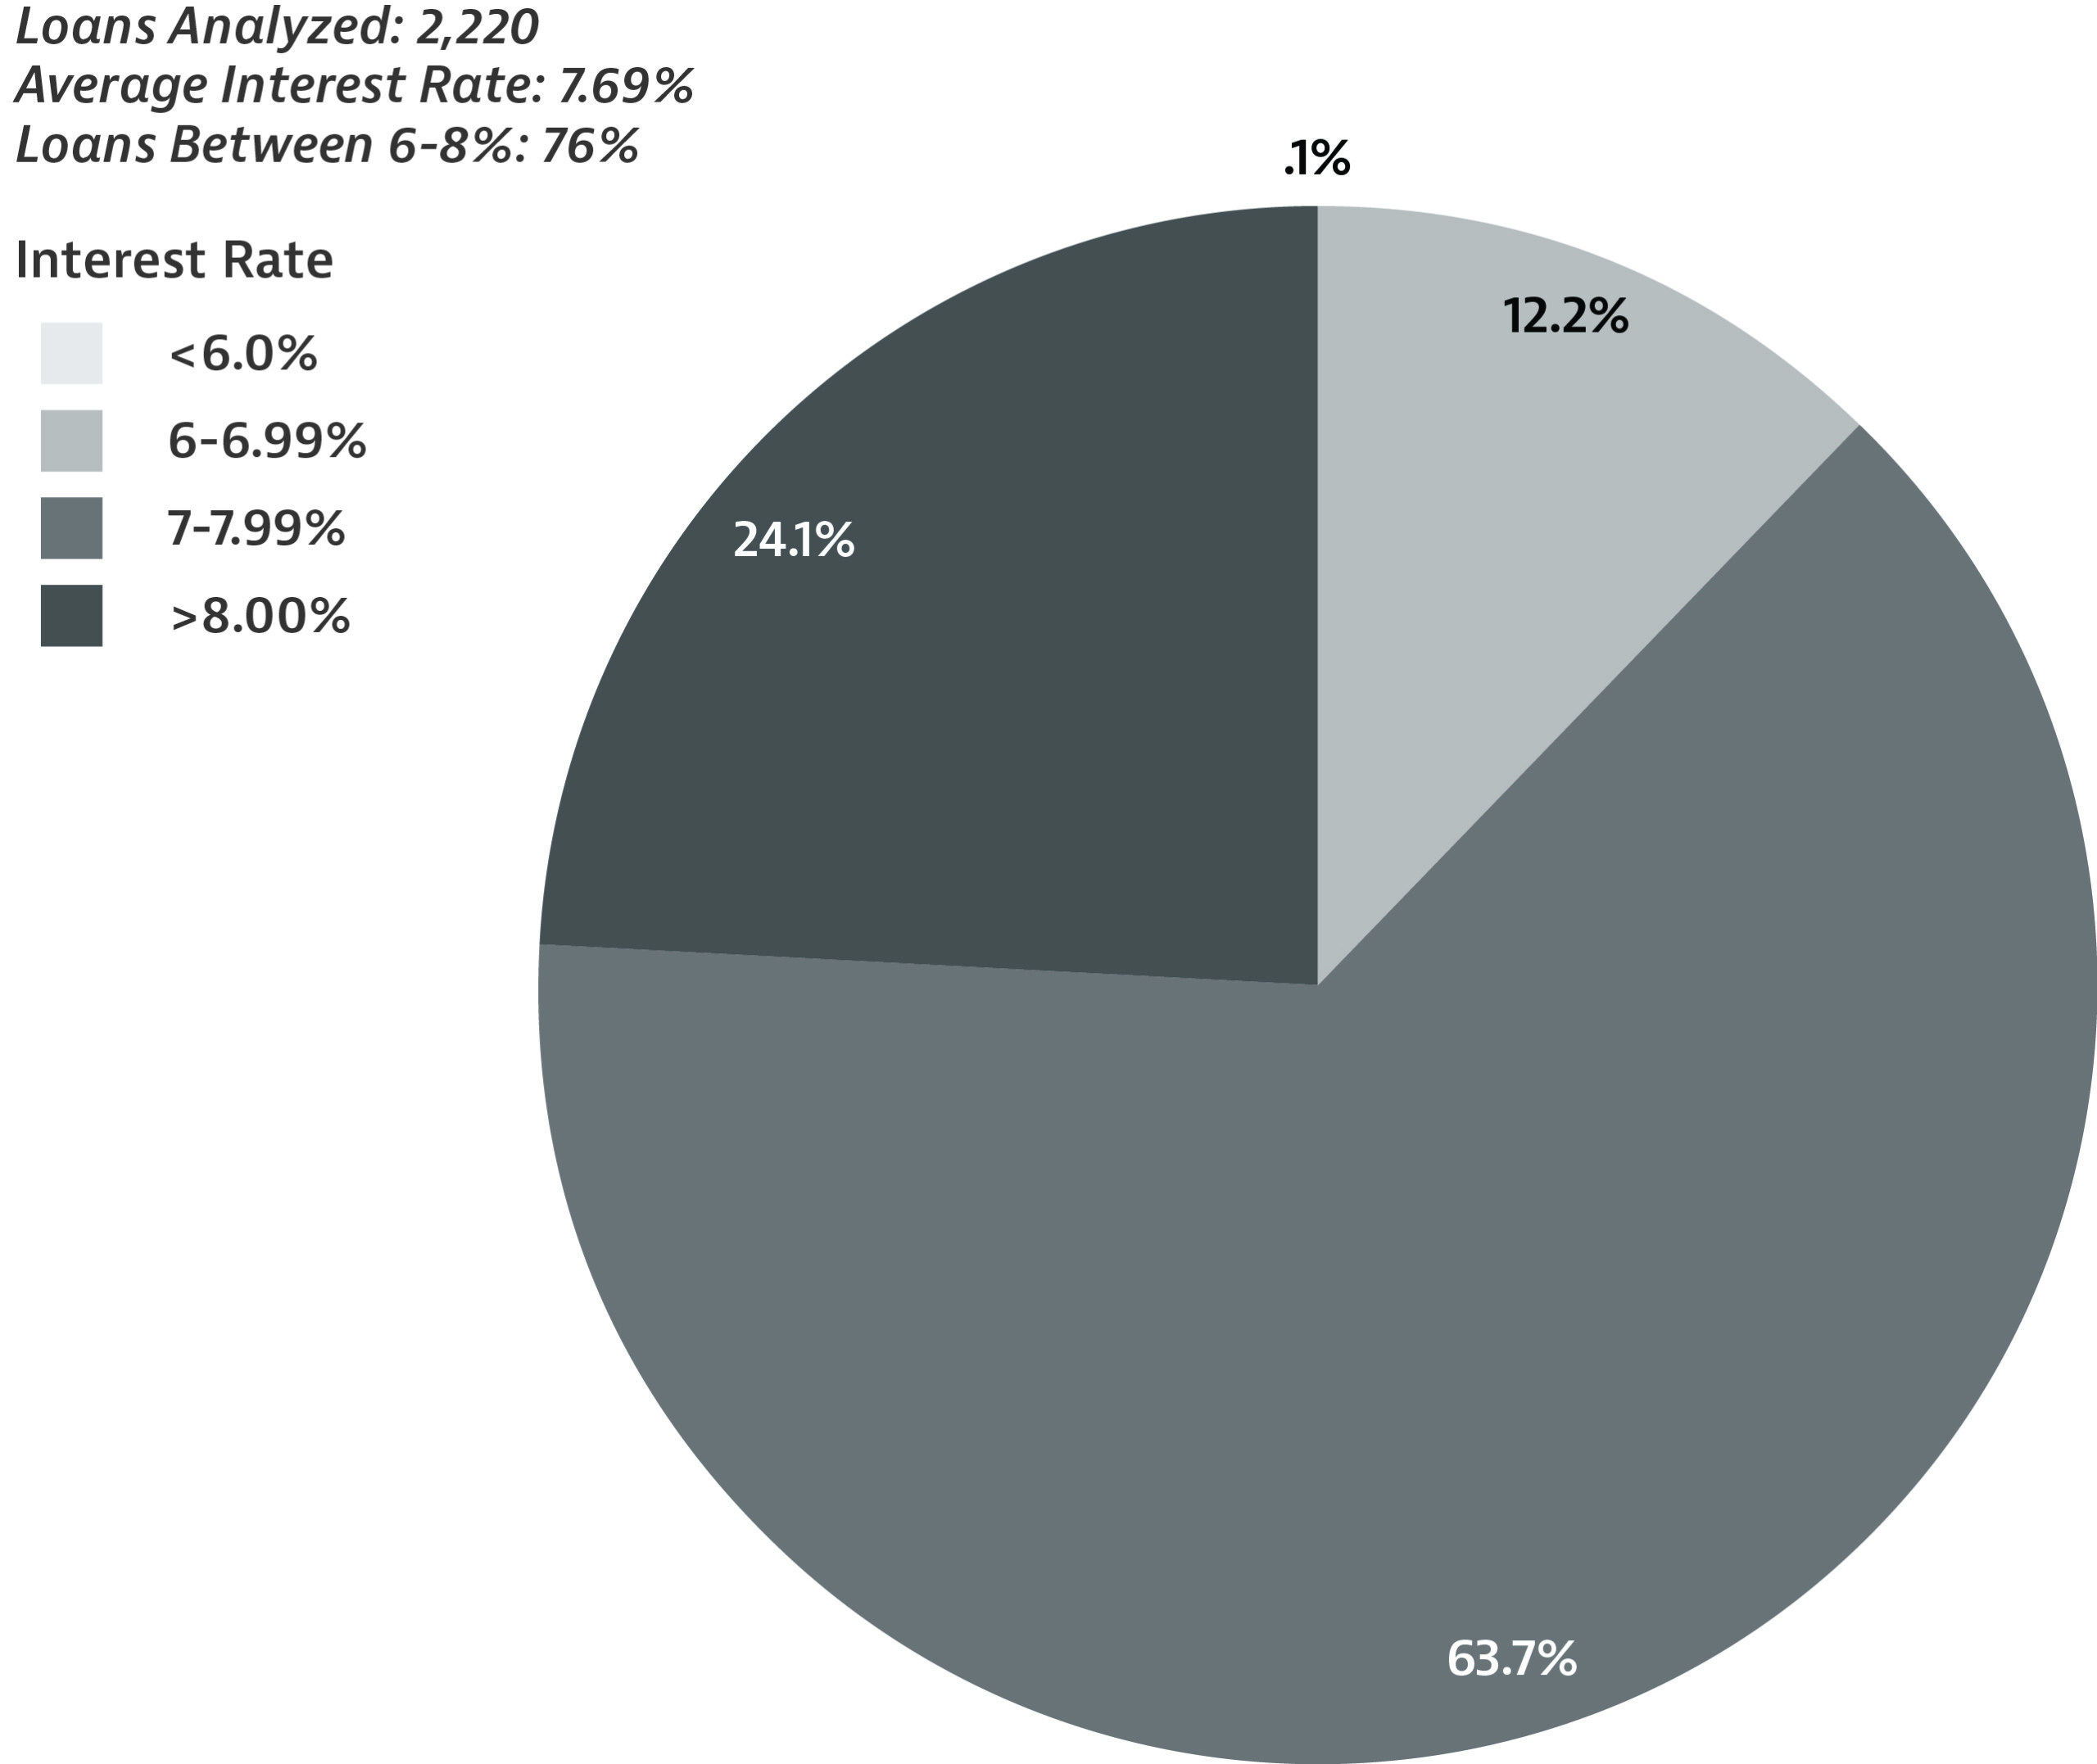
Unlike bridge loans, the DSCR loan market shows less diversification in interest rates. In January 2025, nearly 64% of loans were written between 7–7.99%, with a quarter of the market above 8%, while the sub-seven percent market has continued to shrink (see Fig. 10).
Figure 10. DSCR Interest Rates, January 2025
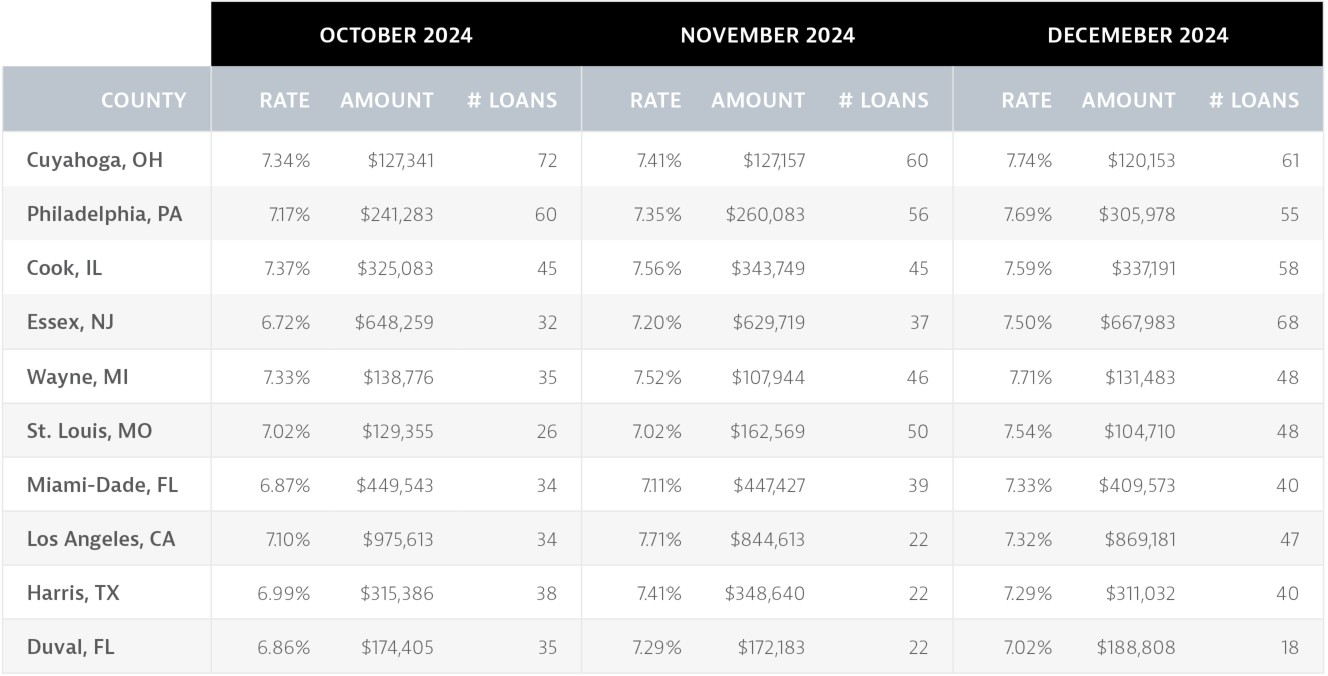
Location, Location, Location (still). Location still matters in the context of DSCR lenders in both loan amounts and average interest rates. Interestingly, certain markets such as Duval County, Florida, where Jacksonville is located, provide generally below-market interest rates and lower loan balances, whereas markets such as Essex County, New Jersey, where Newark is located, tend to provide above-average market interest rates and almost twice the national average for loan balances (see Fig. 11).
Figure 11. Top DSCR Market Activity
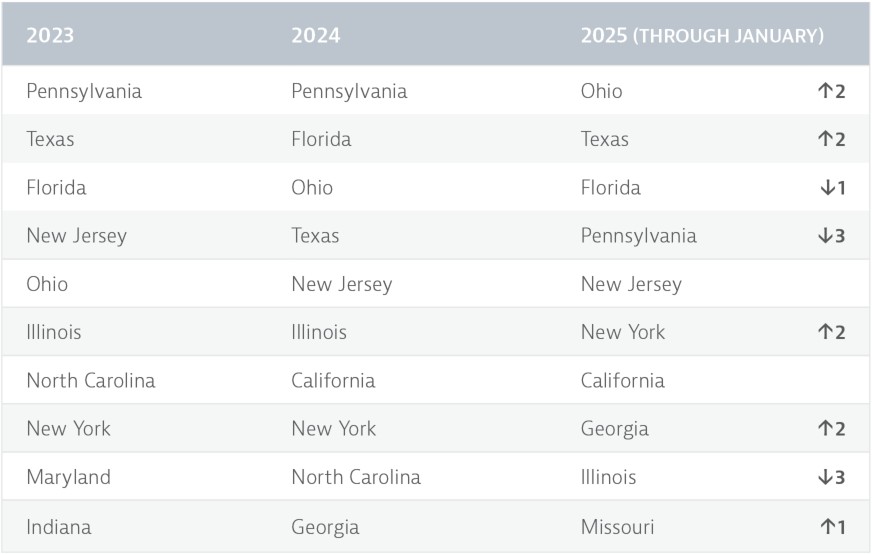
For DSCR lenders, 2024 brought significant changes in where lending activity occurred compared to 2023—quite different from their bridge lender counterparts. The most notable change was California, which became the seventh largest DSCR market in 2024. In early 2025, Ohio and Texas started strong. Missouri also entered the top 10 and North Carolina dropped out (see Fig. 12).
Figure 12. Top DSCR States by Volume
Other Notable Trends
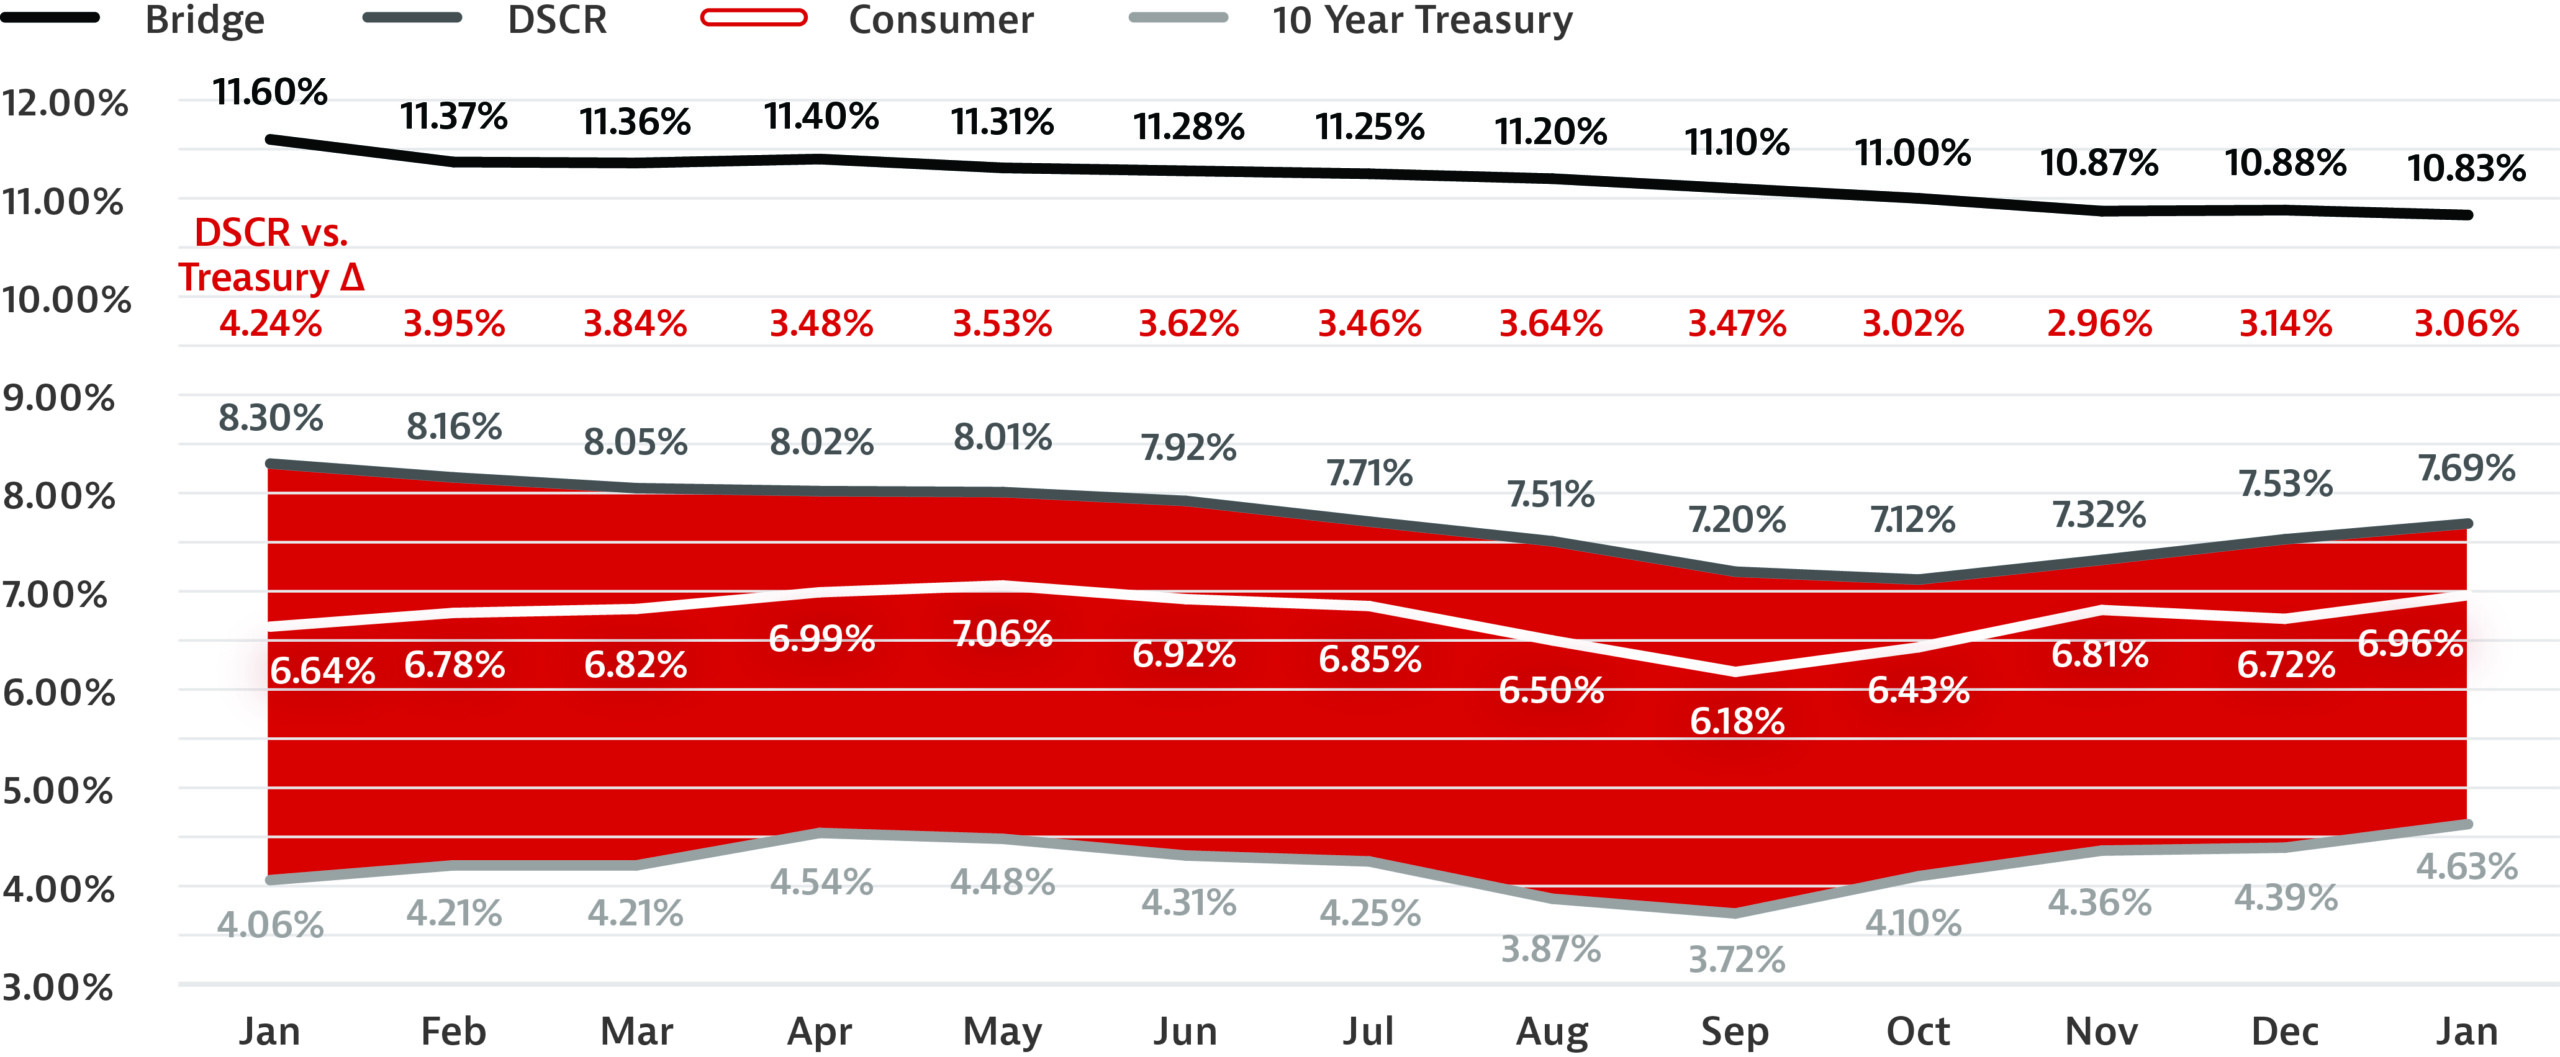
Tightening Spreads. The increase in secondary market activity and the reduction in the Fed monetary policy has influenced both bridge and DSCR interest rates. What is particularly fascinating is the spreads between 10-year treasuries and the average national DSCR rate tightened dramatically throughout 2024 and into early 2025.
For context, the year began with average DSCR rates of 8.3%, while 10-year treasuries averaged 4.06% with a spread of 424 basis points. Fast forward to January 2025 and the 10-year had increased to 4.63% even though the DSCR rates were down to 7.69%, resulting in a 306-basis-point spread between the 10-year and average DSCR rates. Investors appear to be more comfortable with the risks associated with this product as the spreads continue to tighten (see Fig. 13).
Figure 13. Bridge and DSCR Versus Indexes
Consistent Transaction Fees. For bridge and DSCR lenders, transaction fees have remained mostly unchanged in 2024, with most lenders charging a little over 2 points for both DSCR and bridge transactions. Other transaction costs range from an average of $900-$1,300 for document fees, $1,000-$1,300 processing fees, and $1,300-$1,500 underwriting fees.
The data from 2024 and early 2025 paints a clear picture of a rapidly evolving private lending market. Bridge and DSCR loan volumes surged, with DSCR loans experiencing particularly dramatic growth in the second half of the year. Interest rates saw a downward trend, largely driven by improved secondary market conditions, while spreads between DSCR rates and 10-year treasuries tightened significantly.
As we look ahead, private lenders must remain agile, leveraging data-driven insights to navigate market shifts. With spreads tightening, regional disparities in pricing, and sustained demand for both bridge and DSCR loans, staying informed will be critical to maintaining a competitive edge.
Lightning Docs will continue to provide transparency and benchmarking insights for private lenders in an industry that historically lacks meaningful loan-level data. By understanding these trends, lenders can optimize pricing strategies, identify emerging markets, and position themselves for continued success in 2025 and beyond.


Leave A Comment