
Inventory, pending ratios, and price cuts reveal a market recalibrating fast—and creating new investor openings.
The housing market downshifted decisively in 2025 as stubbornly high mortgage rates, tariff uncertainty, and a more laissez faire housing policy from Washington became part of the market milieu.
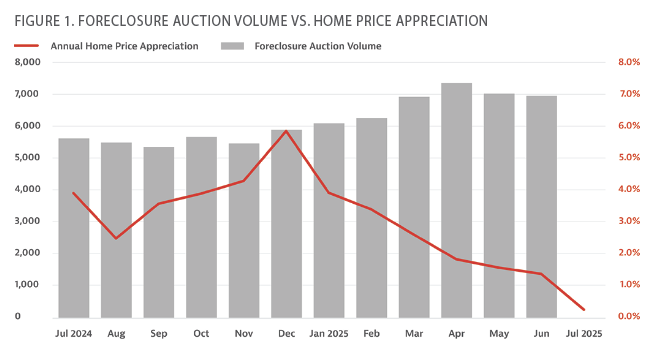
This downshift manifested in more inventory for sale and slowing demand, putting downward pressure on prices and upward pressure on delinquencies and foreclosures. The market’s prevailing winds swung more in favor of buyers and against sellers—even as buyers got more skittish about buying amid uncertainty (see Fig. 1).
These three metrics will be early indicators of whether the market winds from 2025 continue in 2026 or reverse—and how much momentum will be behind them:
Retail inventory (supply)
Pending ratio (demand)
Price cuts (pricing)
Understanding the prevailing housing market winds is important for real estate investors, including those buying distressed properties at auction. Bidding behavior on Auction.com demonstrates that real estate investors are adjusting their acquisition and pricing strategies in response to retail market trends, often ahead of retail market trends based on early indicators like these three metrics.
If the market continues to swing in favor of buyers, savvy investors could see an opportunity to go against the grain and acquire more inventory at bigger discounts, but may need to hold more as rental inventory. If the market swings back in favor of sellers, savvy investors may be willing to buy at lower discounts given the opportunity for higher returns on homes renovated and resold back into the retail market.
“My hold time from two years ago was averaging 120 days. Now I have properties that are sitting with over two years on the market,” wrote a Texas-based Auction.com buyer in a July survey. “Homeowners are starting to drop prices to sell homes to ward off foreclosure, which is starting to create a lower appraised value … for investors. The market is starting to see more foreclosures.”
Despite the downshifting market, 37% of Auction.com buyers surveyed in July said they plan to buy more properties in the next three months than they did in the previous three months. That was up from 33% in the previous quarter but down from 39% a year ago.
The Texas-based buyer said he plans to buy more in the next three months than he did in the previous three months.
“I’ve got money to spend,” he wrote.
Retail Inventory (Supply)
Inventory of existing homes for sale in July increased 25% from a year ago to a 68-month high, making it the highest level since November 2019 and the 21st consecutive month with an annual increase, according to Realtor.com data. It was the third consecutive month with inventory of more than 1 million.
This upward trend in inventory is putting downward pressure on home price appreciation, particularly in markets where inventory has risen above 2019 levels—when the housing market was more balanced between buyers and sellers.
One-third of markets (302 out of 925) registered for-sale inventory in July 2025 that was above July 2019 levels, according to the Realtor.com data. The markets included Miami, Houston, Dallas, Tampa, and Phoenix (see Fig. 2).
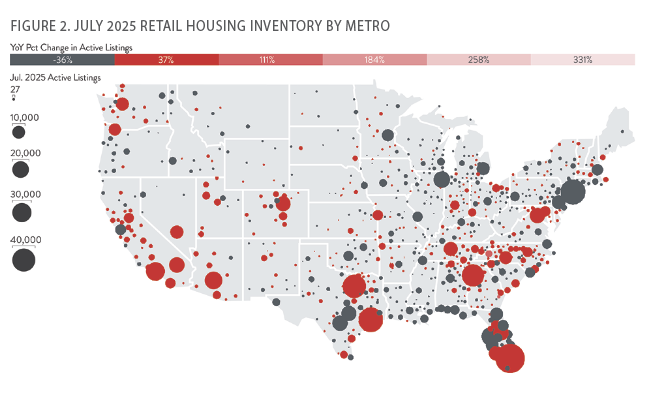
Many of these same markets are seeing home price declines. According to data from ICE Mortgage Technology, one-third of markets saw a decline in home prices on a year-over-year basis in July, including Miami, Houston, Dallas, Tampa, and Phoenix.
To the extent the upward trend in inventory of existing homes for sale continues, expect to see continued pressure on home price appreciation and more markets with negative home price appreciation in 2026. On the other hand, if inventory turns a corner and heads lower, expect to see a rebound in home price appreciation in 2026.
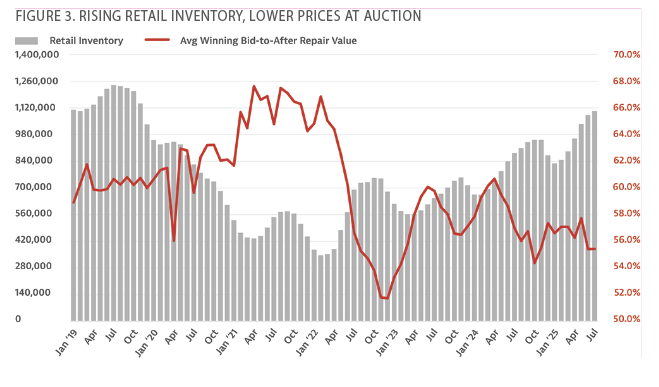
For buyers of distressed properties at auction, more retail inventory likely will translate into less competition and deeper discounts, while lower retail inventory likely will translate into more competition and smaller discounts. This relationship between retail inventory and competition and discounts at auction is illustrated in Figure 3.
Pending Ratio (Demand)
The pending ratio of for-sale inventory is an important but often-overlooked housing metric that helps measure the extent and direction of demand from retail homebuyers. This metric is simply the percentage of homes for sale that are under contract to be sold. A higher percentage indicates stronger demand, and a lower percentage indicates weaker demand.
Nationwide, the pending ratio was 41.8% in July, according to the Realtor.com data. That was down from 44.6% in the previous month and down from 50.7% in July 2024 to the lowest July reading since 2019. July was the 39th consecutive month with a year-over-year decrease in the pending ratio.
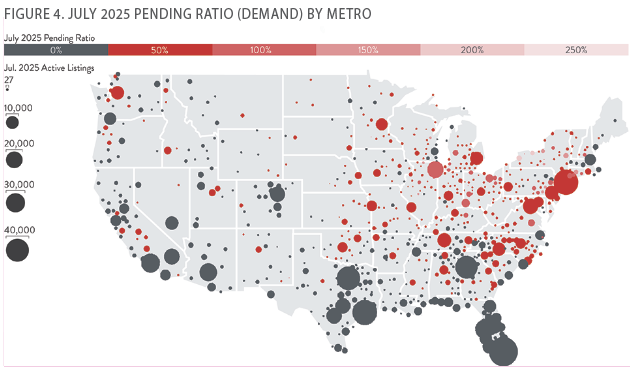
The pending ratio in July 2025 was below July 2019 levels in 269 out of the 925 metro areas included in the Realtor.com data (29%). These markets include Miami, Houston, Dallas, Atlanta and Los Angeles. Retail housing demand has fallen below pre-pandemic levels in those markets, giving buyers the upper hand (see Fig. 4).
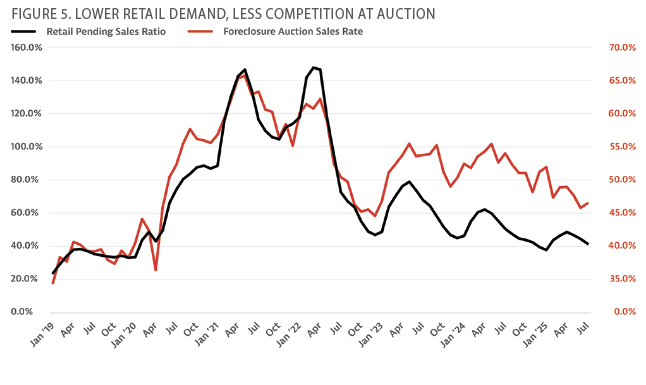
A lower pending ratio means less demand for housing, which works in favor of real estate investors on the acquisition but works against them on the disposition. If the downward trend in retail housing demand continues, investors can expect to see less competition and better discount buying opportunities at auction but also see longer hold times to sell renovated properties (see Fig. 5). This is a trend that may push investors to hold more properties as rentals.
Price Cuts (Pricing)
Rising for-sale inventory (supply) and a falling for-sale pending ratio (demand) indicate mounting downward pressure on home prices and bigger potential discounts for real estate investors. But the share of for-sale listings with price cuts shows whether that downward pressure is enough to motivate sellers to actually lower pricing.
According to the Realtor.com data, 20.6% of for-sale inventory in July 2025 had a price cut, down from 20.8% the previous month but still up from 19.5% in July 2024. Although the month-over-month decline in price cut share could indicate some easing of pressure on sellers, the July 2025 reading was still the highest of any July since 2018, and it was the eighth consecutive month with a year-over-year increase in price cut share.
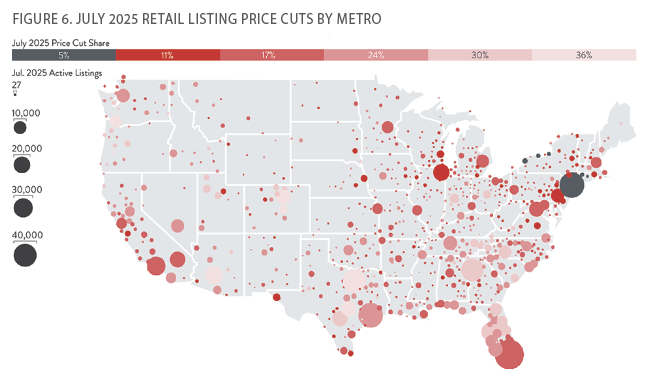
The share of active for-sale listings with price cuts in July 2025 was above July 2019 levels in 681 of the 925 metro areas included in the Realtor.com data (74%). These markets include Miami, Houston, Dallas, Atlanta, and Los Angeles (see Fig. 6).
These trends indicate the combination of rising supply and weakening demand is pushing nearly three-fourths of local markets into buyer market territory. In these markets, more sellers are capitulating on pricing than they were doing so in the balanced market of 2019.
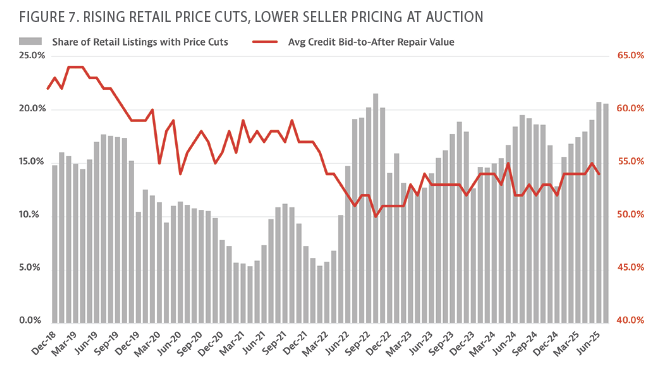
If the share of active listings with price cuts continues to rise, it will further reinforce the implications of rising inventory and falling demand for real estate investors (see Fig. 7). In this scenario, investors can expect to find more and better acquisition opportunities, providing they are willing to go against the grain and be willing to buy when retail buyers are pulling back.
Investors should also expect to hold on to their inventory for longer. Those willing to take on more inventory in the short term will likely be rewarded in the long term because they will be in a position to capitalize on that inventory when the market recovers.


Leave A Comment