
Authors Michael Fogliano and Sean Morgan
Unrecorded loans, rapid flips, and inflated appraisals left clues to one of the largest incidents to hit our industry to date.
In July 2025, Fannie Mae issued an alert about a growing pattern of fraudulent activity involving two-to four-unit investment properties concentrated in New Jersey and surrounding mid-Atlantic and Northeast states. The schemes are complicated with many parties (mortgage brokers, multiple limited liability companies, and settlement companies) working together to manipulate the refinance process.
As a result, the market is on high alert.
The Pattern
To remain vigilant, become familiar with the following patterns that could indicate fraud.
The most prevalent fraud pattern involves rapid property transfers between related LLCs at artificially inflated prices. Properties are purchased and resold within 60 to 180 days between multiple LLCs. Each transaction is supported by fraudulently inflated appraisals (from an appraiser in on the scam) that can dramatically increase the value of property very quickly. This large increase in property value in a very short amount of time is a red flag. The artificial increase in value allows fraudsters to secure loan amounts greater than legitimate market values would support.
Another red flag to watch for is if the original loan is not publicly recorded. Fannie Mae reported that with the help of settlement companies in on the scheme, fraudsters avoid recording hard money loans originally taken on the property, but keep them on title commitments. This helps fraudsters obtain a limited cash out refinance from a future lender. Since full cash out refinances have more stringent requirements, fraudsters will get a limited cash out refinance.
Overall, the schemes rely heavily on hidden ownership structures to create confusion and distance in transaction history, misrepresented property values by malicious appraisers, and settlement companies not recording liens.
Fraud has many forms. Here’s just one example.
First, ABC LLC purchases a property for $200,000, representing its actual market value. ABC LLC pays $50,000 in cash and uses a $150,000 loan that does not get recorded but shows up on the title commitments in the refinance process.
Then, within 30-60 days, the property deed is transferred to related entity XYZ LLC.
At day 60, a new appraisal commissioned by the network shows an inflated value of $350,000—a 75% markup that bears no relation to actual improvements or market conditions.
By day 90, an individual of XYZ LLC applies for what appears to be a “limited cash-out” refinance seeking $280,000.
The lender sees $150,000 of private financing on the title commitment.
Finally, $130,000 is extracted through fraudulent refinance ($280,000-$150,000).
The property enters pre-foreclosure within six months as the inflated loan becomes unsustainable.
In short, by creating artificial value in the property, the fraudster misrepresents the true loan-to-value ratio and their actual cash investment in the properties. This allows the fraudster to extract inflated equity from the property.
Monitoring all of this is challenging. Forecasa tracks these events and normalizes entity names to make this monitoring process easier and more transparent for lenders. Even if someone is operating under multiple LLCs, you can see their entire transaction history in one place. Additionally, we are tracking what we are calling “bad borrowers” on an ongoing basis. Lenders can subscribe to the list, which is updated monthly.
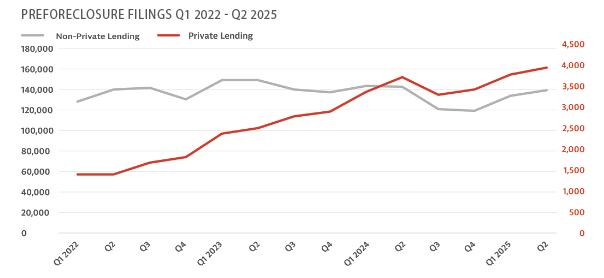
When looking at pre-foreclosure filing nationwide, we can see an increase in pre-foreclosures with private lenders over the last few years. The figure on the preceeding page shows that from 2022 through mid-2025, traditional mortgage pre-foreclosure filings remained relatively stable, but private lending pre-foreclosure filings increased significantly.
Note: Pre-foreclosure filings (private lending) counts all pre-foreclosure filings with a private lender present on the transaction. There may be more pre-foreclosure filings tied to a private lending loan where the private lender is not listed on the preforeclosure. Pre-foreclosure filings (non-private lending) are all pre-foreclosures without a private lender listed on the transaction.
Preforeclosure filings with private lenders increased from 1,434 quarterly filings in first quarter 2022 to 4,011 in second quarter 2025—a 179% increase over just 3.5 years. The growth wasn’t perfectly linear, with its largest increases occurring at the start of each calendar year. It’s possible that in the past, private lenders were not recording pre-foreclosures as a common practice, which could impact the increase seen here.
Meanwhile, pre-foreclosures without private lender involvement followed a different trajectory. Starting at 101,151 quarterly filings in first quarter 2022, they fluctuated within a relatively stable range, declining to 108,880 by second quarter 2025. Although traditional lenders maintained steady foreclosure patterns, private lending defaults have been increasing. Here are highlights of some key quarterly pre-foreclosure milestones for private lending pre-foreclosures overall during the last few years:
2022: Private lending PFCs averaged 1,627 per quarter
2023: Average jumped to 2,733 per quarter (+68%)
2024: Average reached 3,558 per quarter (+30%)
2025: On pace for 3,955 per quarter
Among private lenders originating mortgages between July 2024 and July 2025, we reviewed all their borrowers and tracked which ones had any pre-foreclosure history. Any borrower that has ever been on a pre-foreclosure filing is counted as a “Bad Borrower.” The findings demonstrate a variation in underwriting standards and risk management practices across the industry.
The top 25 private lenders by mortgage originations demonstrated relatively conservative risk profiles. On average, 2.5% of each lender’s borrowers had a preforeclosure in the past. A low percentage could signal that the top private lenders are using effective screening procedures to identify and avoid problematic borrowers.
However, the range within this group was significant. The most conservative lender maintained a bad borrower rate of just 0.6%, while the highest-risk lender in the top 25 reached 5.8%—nearly 10 times higher. This spread indicates that even among high-volume lenders, risk management approaches vary.
When expanding the analysis to all private lenders with at least 10 unique borrowers during the period, the average bad borrower percentage increased to 4.4%. This 76% jump from the top 25 average suggests that smaller or newer private lenders may have less stringent underwriting standards or less sophisticated risk assessment capabilities.
Market Impact
Lenders understand that association with fraudulent actors, even unknowingly, can result in significant financial losses and regulatory scrutiny. Thus, the fraud revelations have prompted swift defensive measures across the private lending industry. Some lenders have paused activity in Baltimore and other high-risk markets identified in Fannie Mae’s alerts. In the Baltimore MSA, specifically, we can see that from May to July 2025, private lending originations are down 36% compared to private lending originations from the previous three months (February–April 2025).
Private lenders are implementing enhanced due diligence procedures that go far beyond traditional credit checks. New standard practices include detailed property history analysis, ownership verification for LLCs, and mandatory recorded lien searches. These measures, while necessary for fraud prevention, add time and cost to the lending process. Additionally, lenders are now scrutinizing relationships with appraisers, title companies, and settlement agents, creating additional compliance layers that legitimate borrowers must navigate.
Since lenders have responded, the markets associated with fraud schemes face reduced liquidity. The reduction in lending activity impacts real estate investors who depend on private lending for time-sensitive transactions.
Although fraud schemes have created significant challenges, the rapid industry response and emerging risk management practices suggest the market is adapting. Lenders, investors, and regulators who pay attention to these leading indicators will be better positioned to navigate the evolving risk landscape and maintain access to capital for legitimate borrowers.


Leave A Comment