
Foreclosure Auction Volume Increases 33% in Q1 2026 to a Six-Year High as Distressed Supply Continues to Normalize to Pre-Pandemic Levels
Selective demand gains and uneven pricing signals point to continued normalization rather than acceleration.
April 23, 2026
Key Points
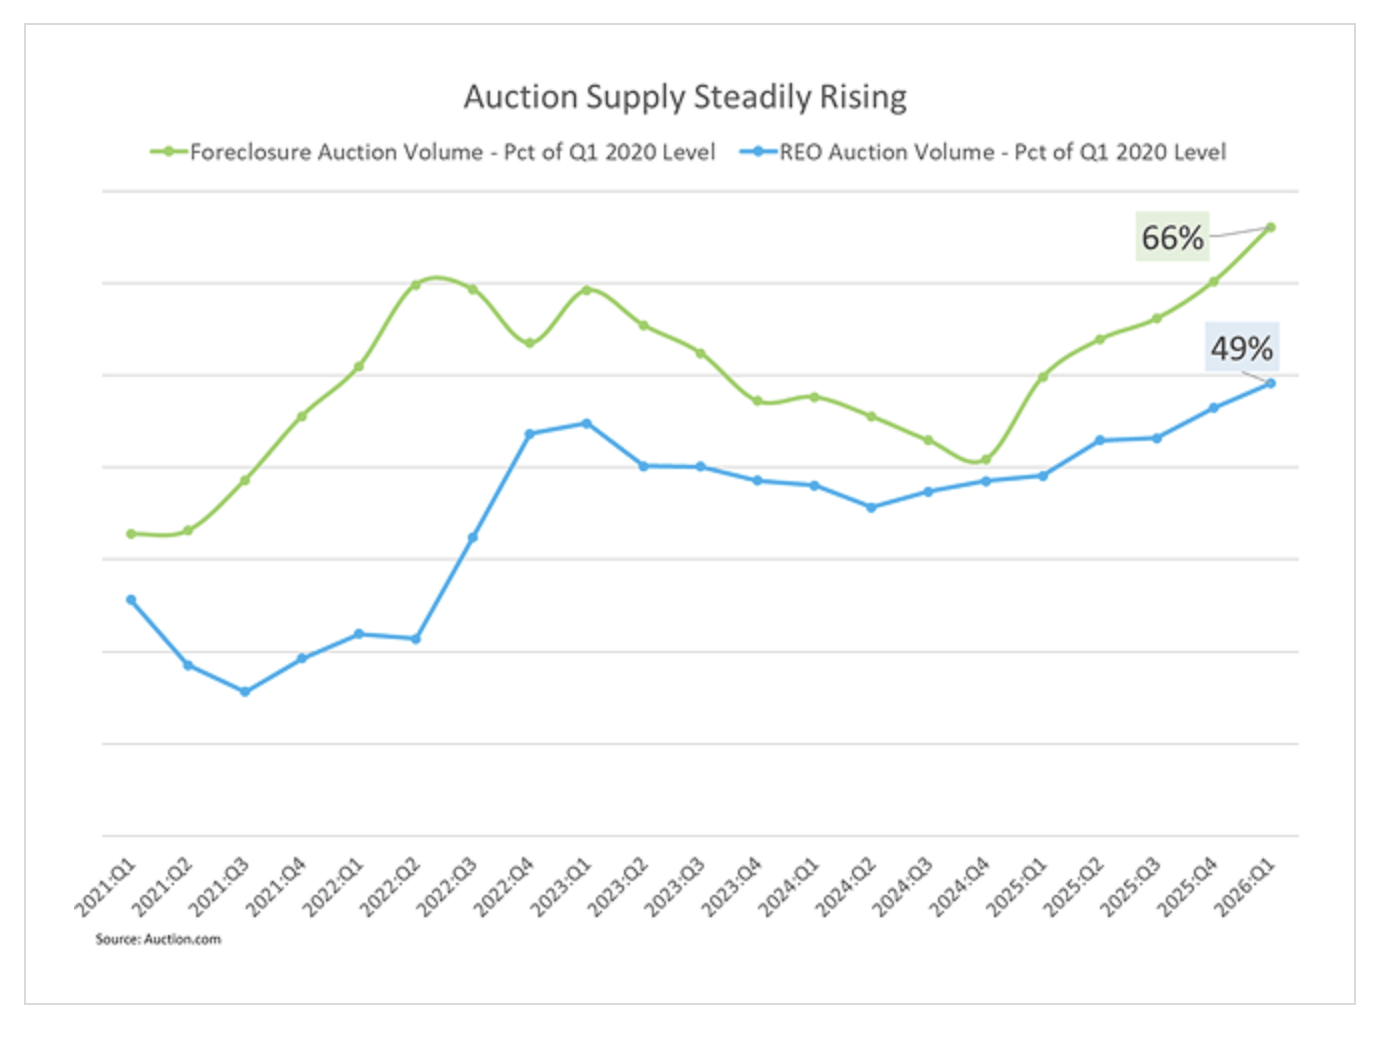
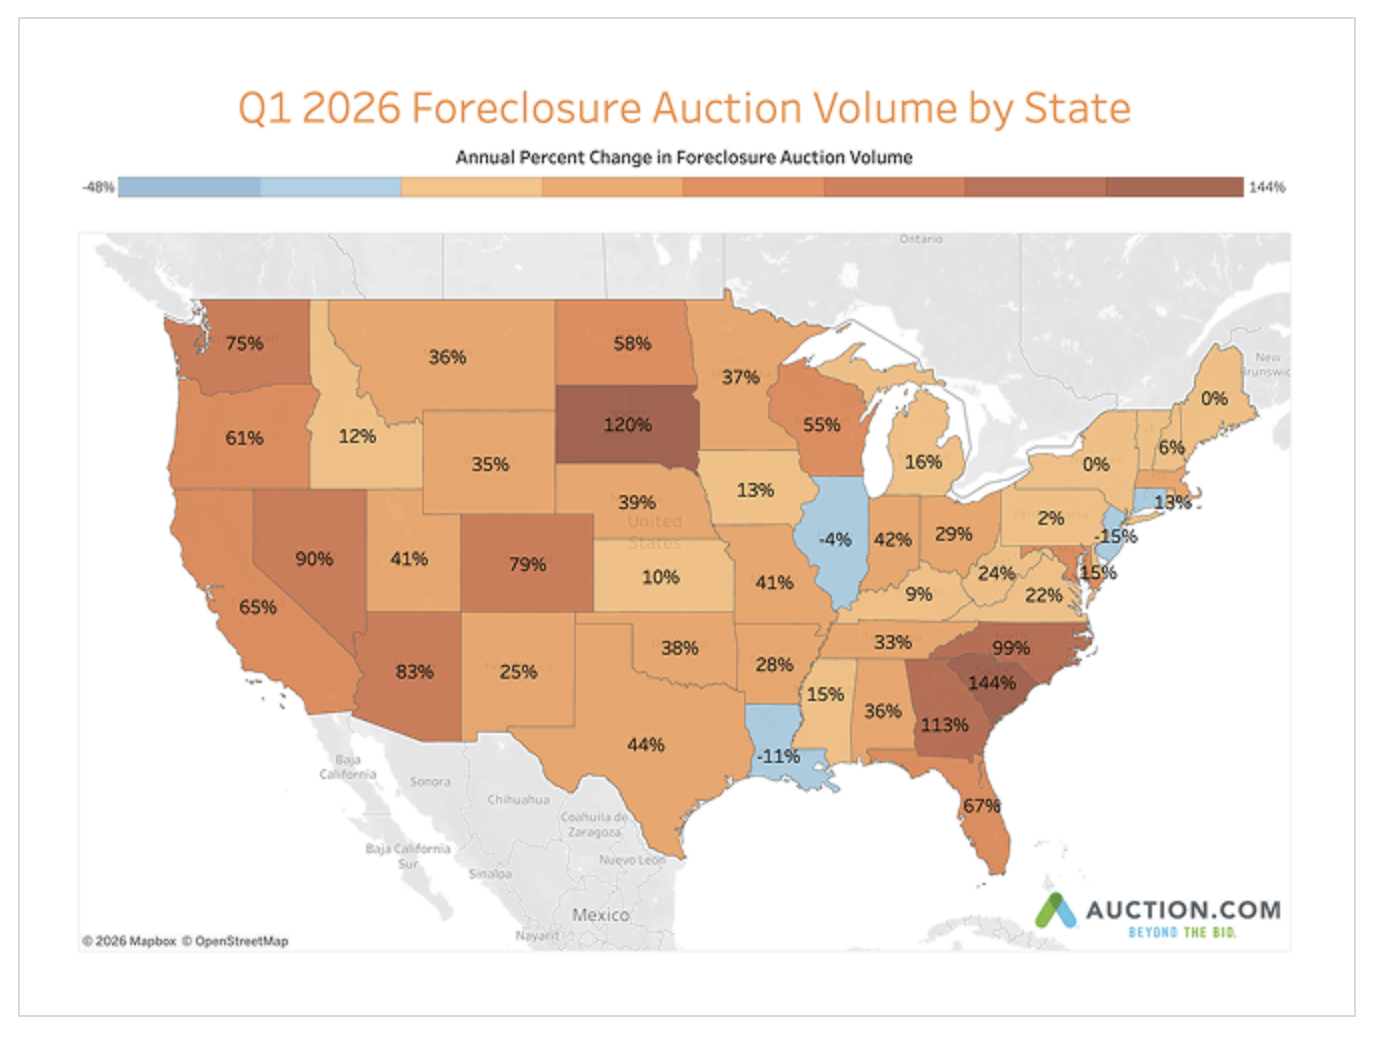
- Completed foreclosure auctions reached 66 percent of their Q1 2020 level in Q1 2026, up approximately 10 percent from Q4 2025 and 33 percent from a year ago.
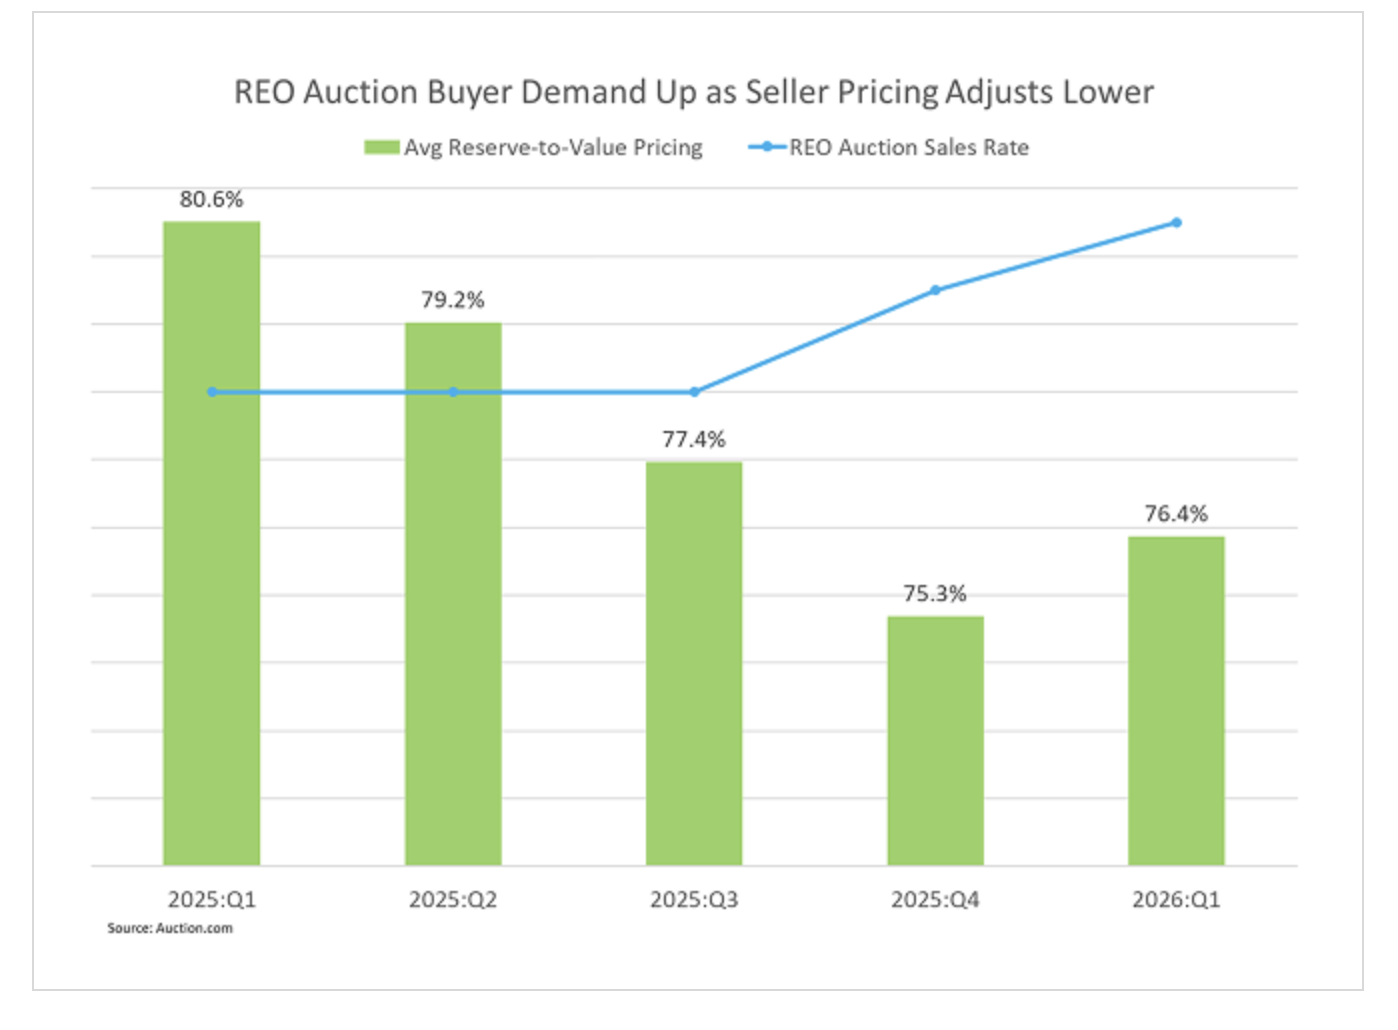
- Real Estate Owned (REO) auction volume reached 49 percent of its Q1 2020 level, up 6 percent from the previous quarter and 26 percent from Q1 2025.
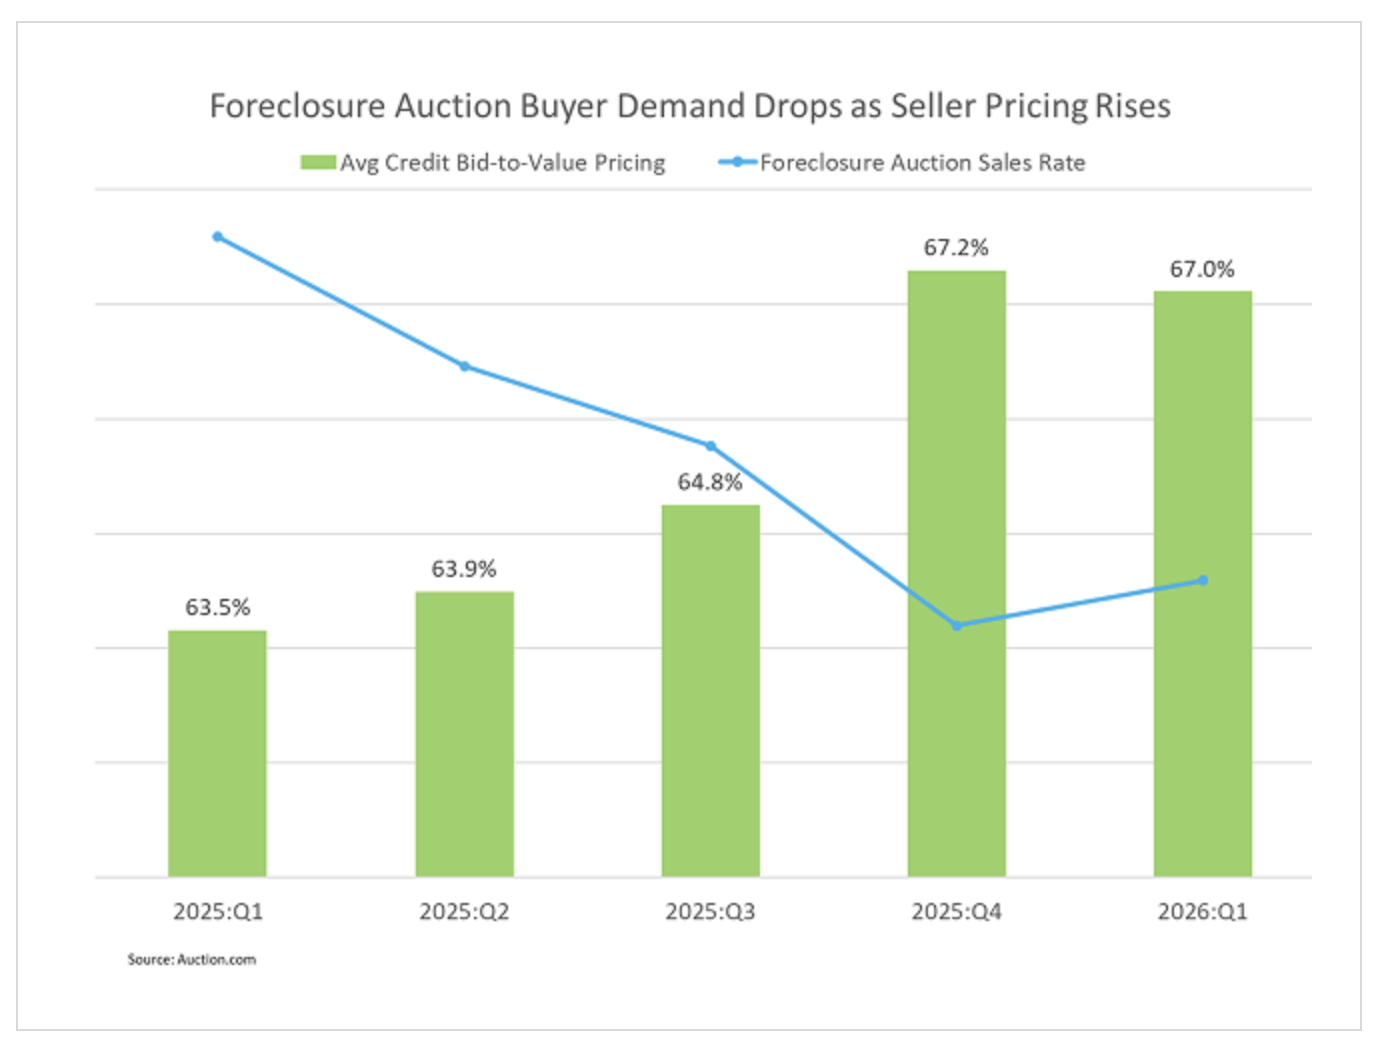
- Demand improved more noticeably at REO auction than at foreclosure auction, likely because of more market-attuned pricing. The REO auction sales rate increased 12 percent quarter-over-quarter and 36 percent year-over-year, while the foreclosure auction sales rate rose 2 percent from the previous quarter but declined 12 percent from a year ago.
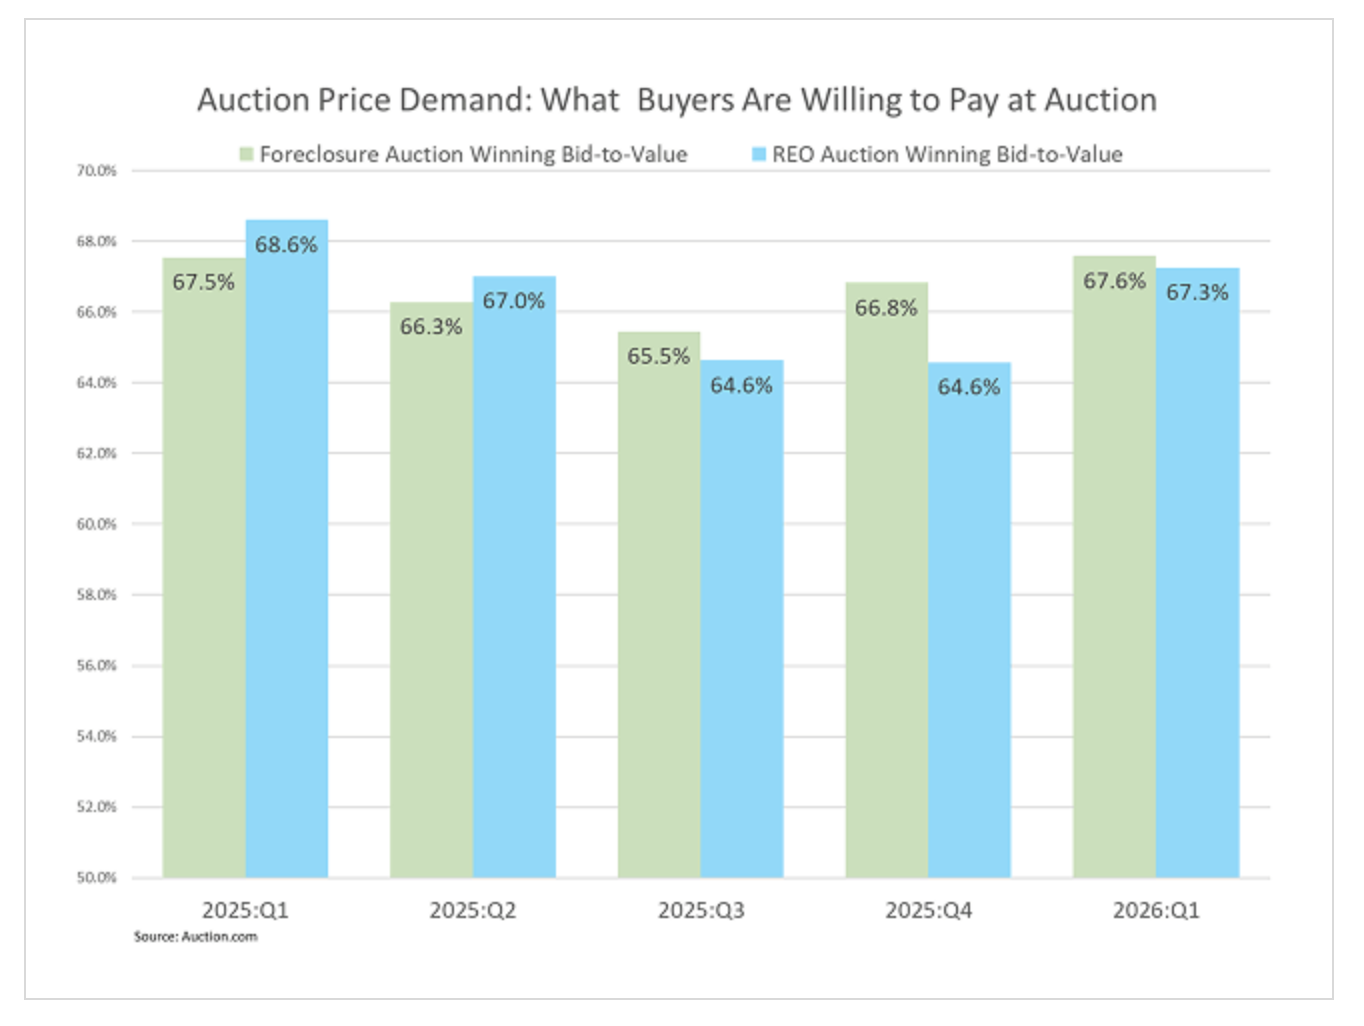
- Buyer price demand moved higher from the previous quarter at both foreclosure and REO auction. Foreclosure auction buyers were willing to pay 67.6 percent of estimated retail market value in Q1 2026, while REO auction buyers were willing to pay 67.3 percent.
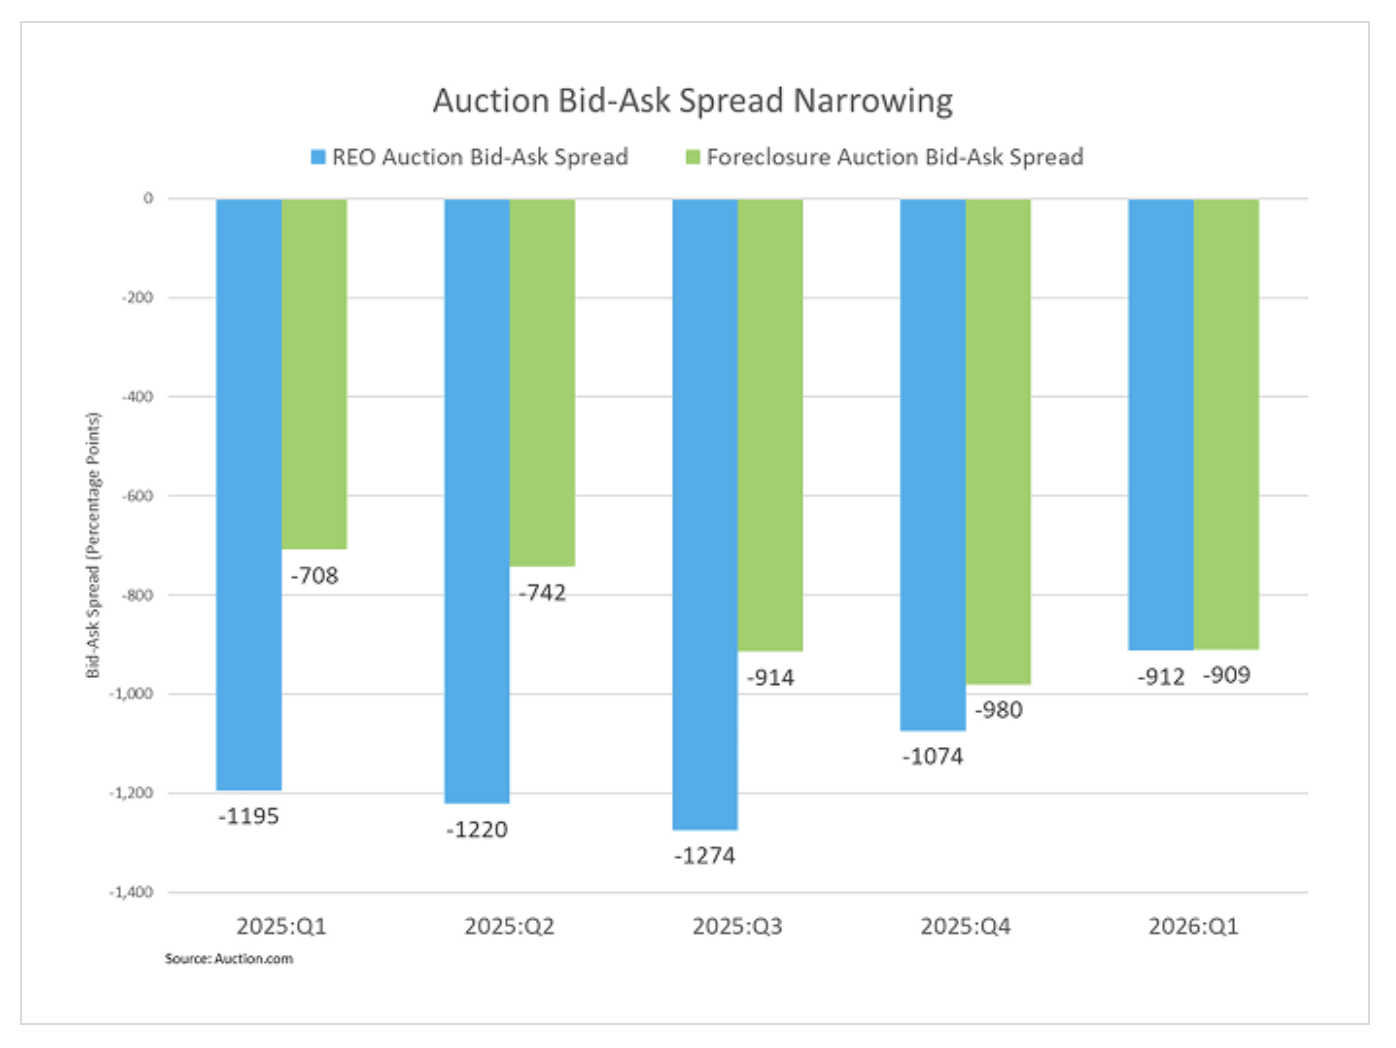
- Bid-ask spreads narrowed quarter-over-quarter at both auction types. The REO auction bid-ask spread narrowed to approximately 912 basis points as sellers adjusted pricing lower compared to a year ago, and foreclosure auction bid-ask spread narrowed to approximately 909 basis points despite seller pricing rising from a year ago.
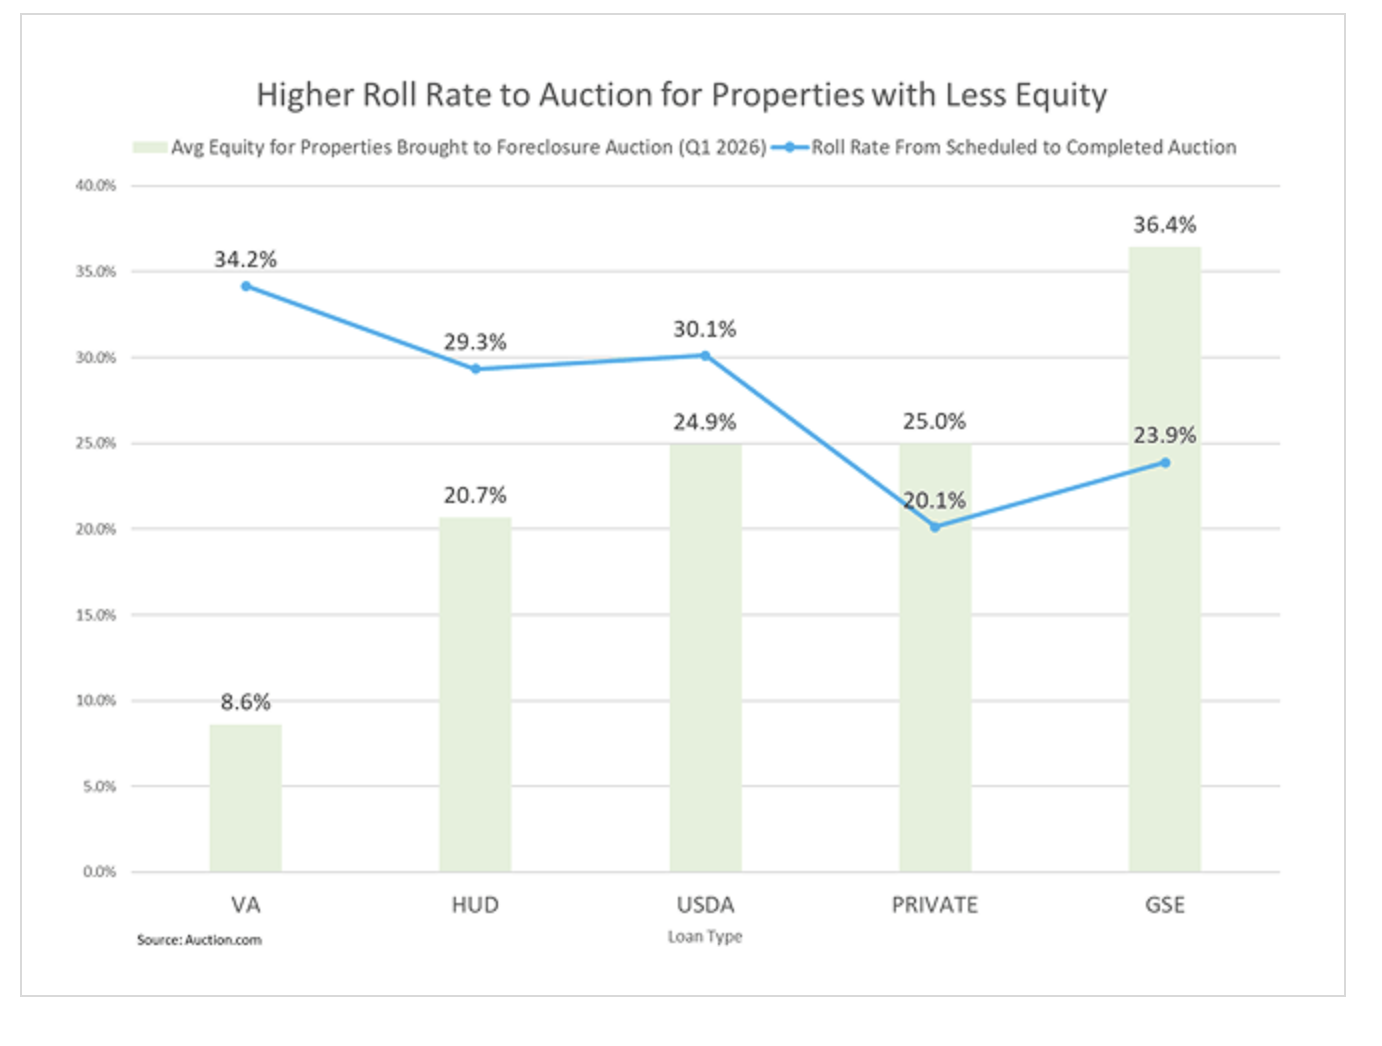
- Average equity for scheduled foreclosure auctions declined to 26.9 percent of value, down 6 percent quarter-over-quarter and 13 percent year-over-year, putting more upward pressure on the roll rate from scheduled to completed foreclosure auction.
Overview
Auction volume continued its steady ascent back toward pre-pandemic levels in Q1 2026, reflecting a continued normalization rather than a new crisis in the distressed property market. Foreclosure supply kept rebuilding, with both completed and scheduled foreclosure auctions moving closer to Q1 2020 levels, while REO auction volume also continued its gradual recovery. The quarter’s supply metrics pointed to a healthier flow through the pipeline rather than a sharp shift in distressed trends.
Demand signals were firmer than they were late in 2025, but the improvement was selective. REO auction demand strengthened more clearly than foreclosure auction demand, and buyer price tolerance stabilized unevenly across local markets. At the same time, seller pricing adjusted gradually in response to those local conditions, helping narrow bid-ask spreads on a quarter-over-quarter basis.
Lower borrower equity remained part of the backdrop. Average equity for scheduled foreclosure auctions declined to 26.9 percent of value, placing more upward pressure on roll rates from scheduled to completed auction.
Distressed Demand
Buyer quantity demanded improved in Q1 2026 at REO auction, likely a result of lower seller pricing at REO auction compared to a year ago (see Distressed Pricing section below). The REO auction sales rate — the quantity of properties buyers were willing to buy as a percentage of properties available for sale — increased 12 percent from Q4 2025 and 36 percent from a year ago, signaling a meaningful pickup after weaker demand late in 2025.
By contrast, the foreclosure auction sales rate increased 2 percent quarter-over-quarter but remained 12 percent below its year-ago level as seller pricing at foreclosure auction decreased slightly from the previous quarter but was up from a year ago (see Distressed Pricing section below).
Relative to Q1 2020 norms, the two auction channels continued to follow different normalization paths. The REO auction sales rate ran at approximately 90 percent of its Q1 2020 level in Q1 2026, while the overall foreclosure auction sales rate stood at roughly 103 percent of its Q1 2020 level. Average bidders per REO auction increased to 2.7, up 8 percent from Q4 2025 but down 14 percent from Q1 2025, suggesting better engagement than the previous quarter but less competitive pressure than a year earlier.
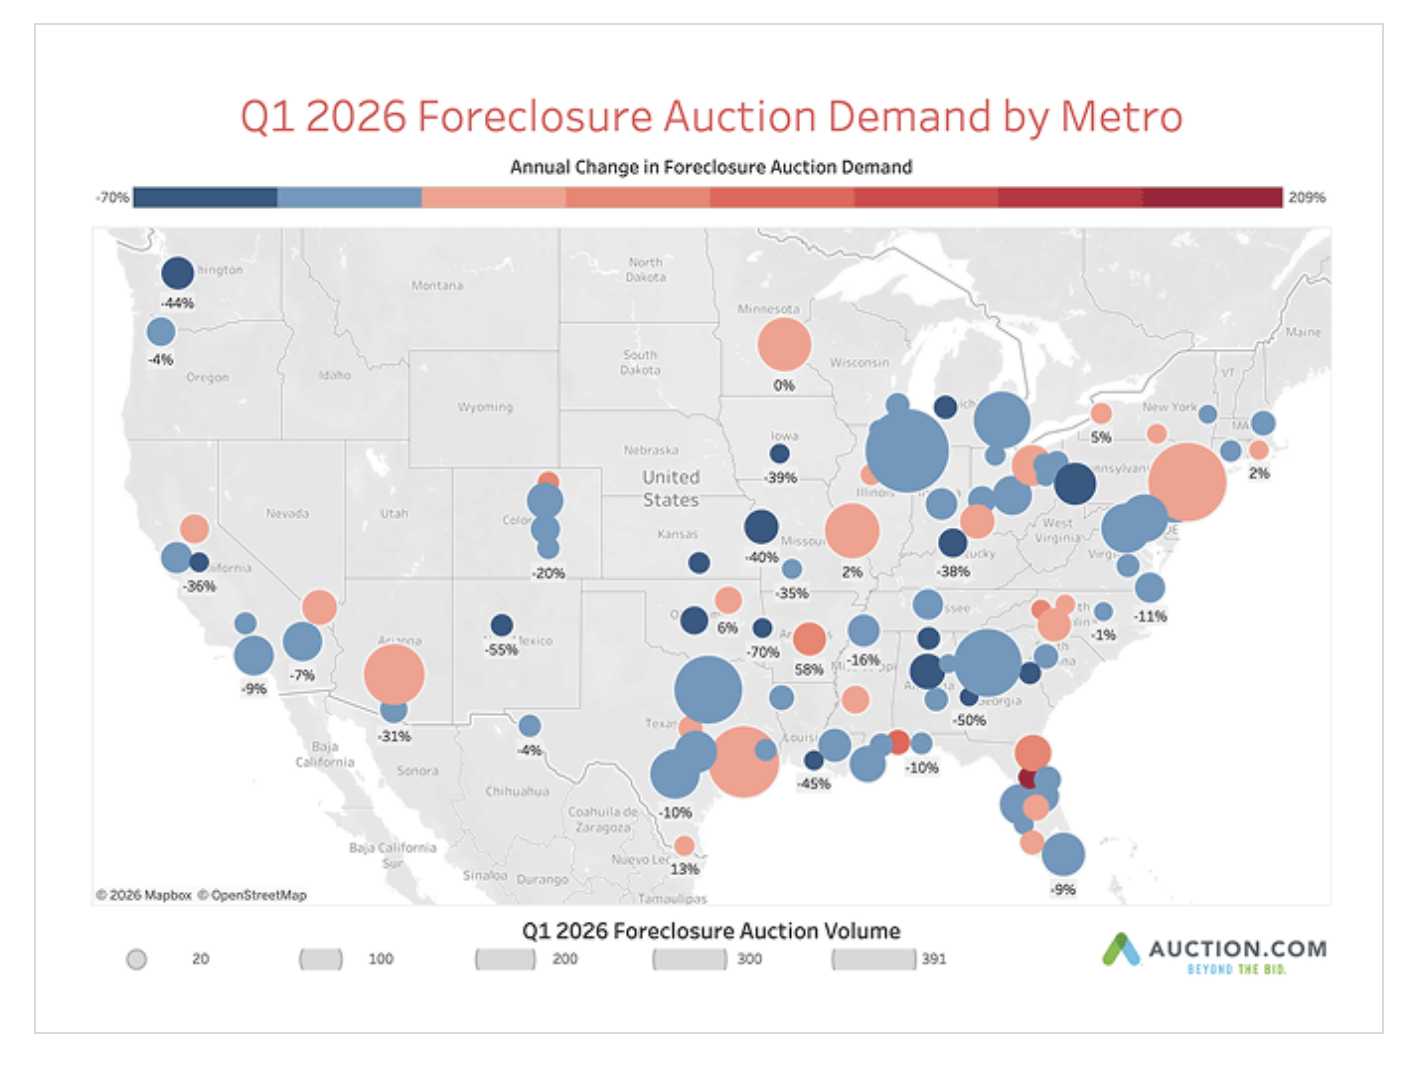
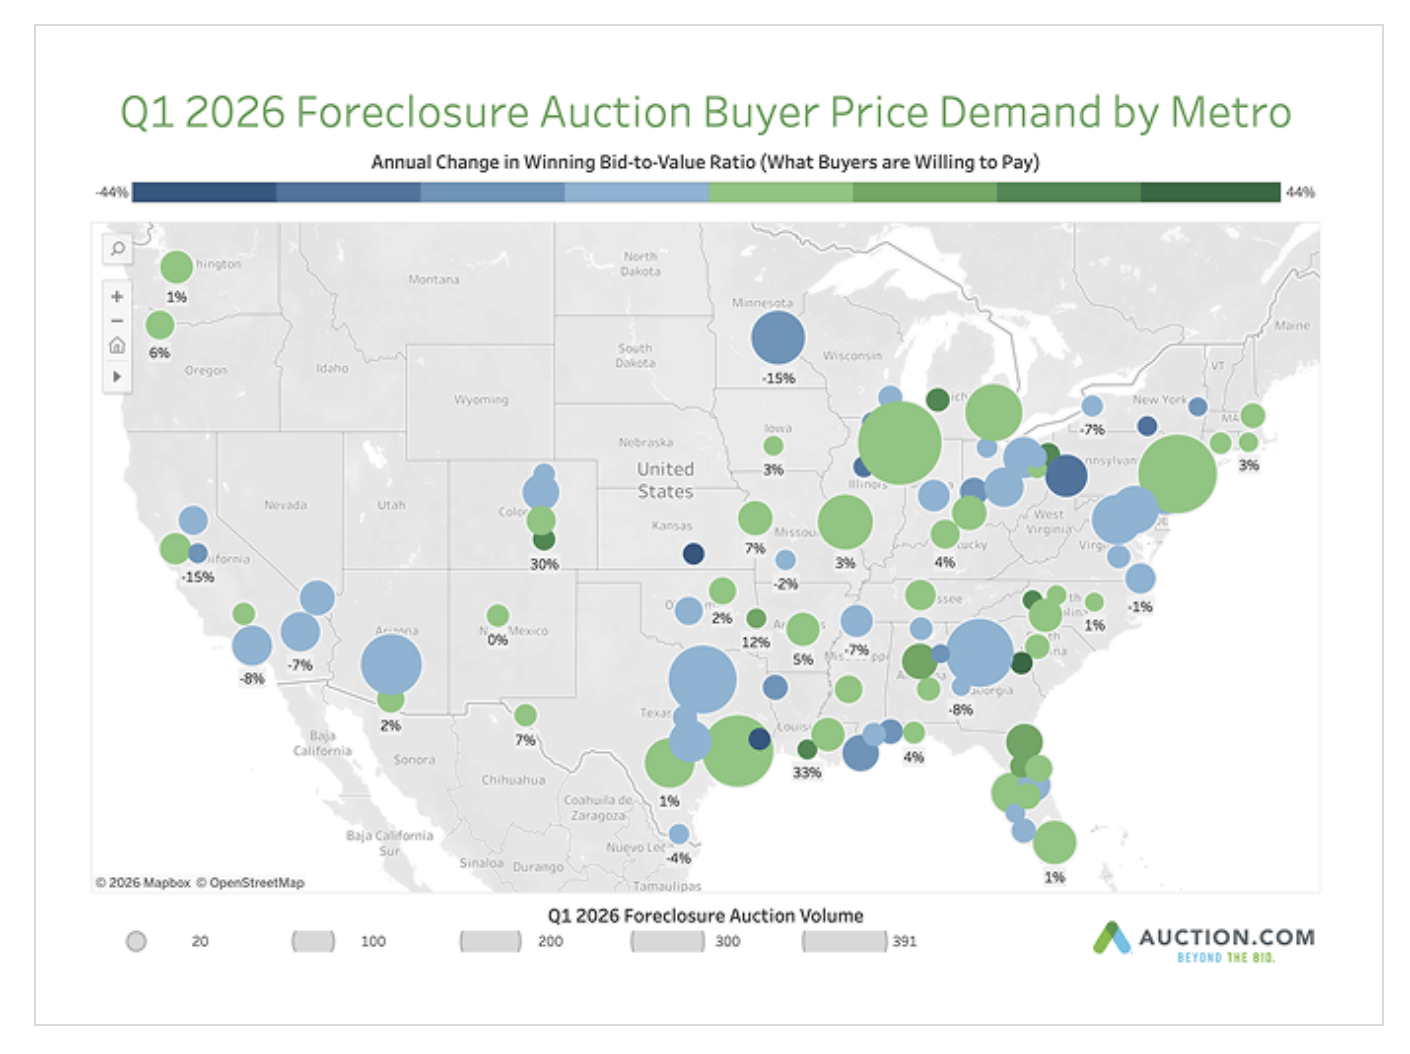
Market-level demand remained uneven among Metropolitan Statistical Areas (MSAs). Twenty-six MSAs, or 27 percent, recorded higher foreclosure sales rates than a year ago, while 70 MSAs, or 72 percent, saw sales rates decline. Among the highest-volume MSAs with improving sales rates, New York, Houston, Phoenix, St. Louis and Cleveland posted year-over-year gains ranging from roughly 2 percent to 7 percent. Among the highest-volume MSAs with declining sales rates, Chicago, Atlanta, Dallas-Fort Worth and Detroit recorded year-over-year declines ranging from roughly 3 percent to more than 30 percent.
“Expecting more inventory in the second quarter of 2026,” wrote Patrick, a Cleveland, Ohio, Auction.com buyer, in response to a buyer sentiment survey in Q1 2026. “This is impacting how I am currently investing as more inventory will most likely lower overall prices.”
The MSAs with the highest sales rates in Q1 2026 included Providence, Milwaukee, Richmond, Boston and Buffalo. The MSAs with the lowest sales rates included Minneapolis-St. Paul, Albuquerque, Lafayette, Pittsburgh and Pueblo.
Price Demand
Buyer price demand — what buyers were willing to pay at auction — increased from the previous quarter at both REO and foreclosure auction in Q1 2026, although the year-over-year trend was more mixed. REO auction buyers were willing to pay an average of 67.3 percent of estimated retail market value, up from 64.6 percent in Q4 2025 but down from 68.6 percent a year ago. That represented 102 percent of the Q1 2020 level.
Foreclosure auction buyers were willing to pay an average of 67.6 percent of estimated retail market value in Q1 2026, up from 66.8 percent last quarter and essentially unchanged from a year ago. That equated to roughly 94 percent of the Q1 2020 benchmark, indicating that foreclosure auction buyer price demand remained below its pre-pandemic reference point even as it improved sequentially.
At the market level, buyer price demand was almost evenly split between gains and declines. Forty-eight MSAs, or 49 percent, recorded higher buyer price demand than a year ago, while 49 MSAs, or 51 percent, saw price demand decline. Among the highest-volume MSAs with rising price demand, Chicago, New York, Houston, Detroit and St. Louis recorded year-over-year increases ranging from roughly 1 percent to 6 percent. Among the highest-volume MSAs with declining price demand, Dallas-Fort Worth, Atlanta, Phoenix and several smaller markets saw declines generally in the low- to mid-single-digit range.
The MSAs with the highest buyer price demand in Q1 2026 included Ocala, Hartford, Bakersfield, Las Vegas and Orlando. The MSAs with the lowest buyer price demand included Beaumont-Port Arthur, Pittsburgh, Hickory, Binghamton and Minneapolis-St. Paul.
Distressed Supply
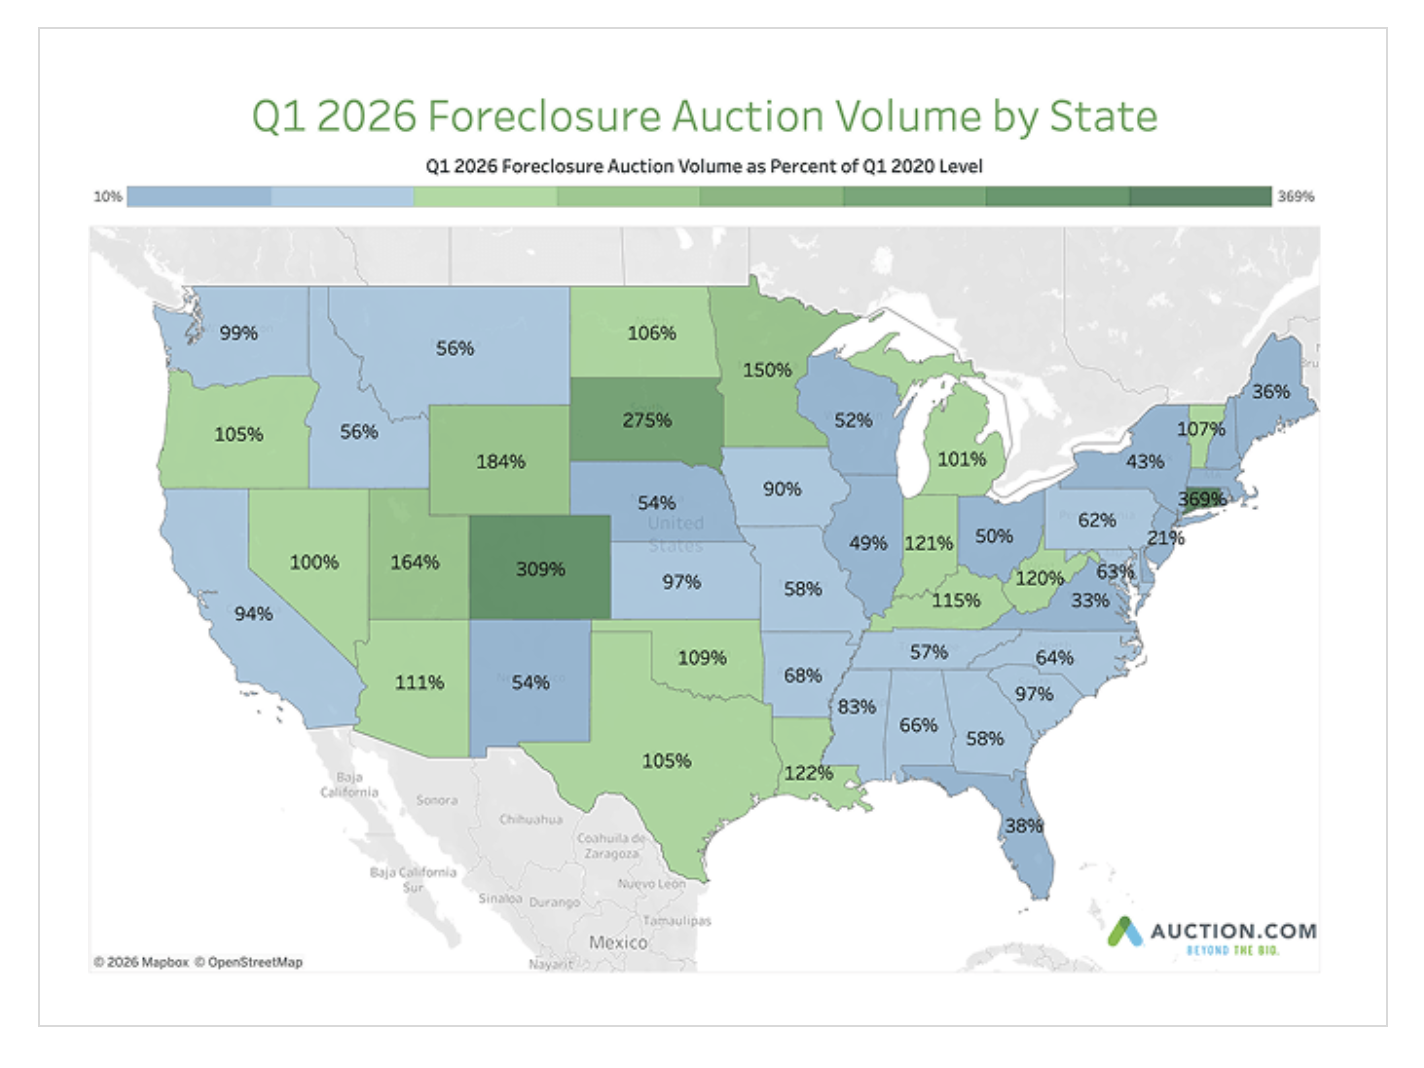
Distressed supply continued to rebuild in Q1 2026. Completed foreclosure auctions increased to 66 percent of their Q1 2020 level, up approximately 10 percent from Q4 2025 and 33 percent from a year ago, continuing the gradual normalization in foreclosure resolution activity. Scheduled foreclosure auctions rose to approximately 69 percent of their Q1 2020 level, up 11 percent quarter-over-quarter and 16 percent year-over-year, indicating additional supply is likely to flow through the auction pipeline in coming quarters.
REO auction volume also moved higher, reaching 49 percent of its Q1 2020 level. That was up 6 percent from the previous quarter and 26 percent from Q1 2025, reflecting a modest but steady recovery in REO dispositions. The BTA rate edged down to 26.2 percent in Q1 2026, down 1 percent from Q4 2025 but up 14 percent from a year ago, showing buyers continued to take a larger share of bids to title despite the sequential slowdown.
By loan type, BTA supply increased on both a quarterly and annual basis across most loan types, led by VA-insured and HUD loans, while private-label loans remained well below pre-pandemic levels. VA BTA volume in Q1 2026 exceeded 100 percent of its Q1 2020 level, while GSE and HUD loans remained below pre-pandemic norms but continued to recover.
Average equity for scheduled foreclosure auctions declined to 26.9 percent of value, down 6 percent quarter-over-quarter and 13 percent year-over-year.
By state, foreclosure supply growth remained broad-based. Forty-five states reported an increase in BTA volume from a year ago in Q1 2026. Eighteen states recorded BTA volumes above their Q1 2020 levels, indicating that foreclosure supply had fully normalized in a subset of lower-48 markets.
Distressed Pricing
Seller pricing adjusted gradually in Q1 2026, contributing to narrower bid-ask spreads on a quarter-over-quarter basis. At REO auction, the bid-ask spread narrowed to approximately 912 basis points, down from 1,074 basis points in Q4 2025 and 1,195 basis points a year ago. REO reserve-to-value averaged 76.4 percent, up 106 basis points quarter-over-quarter but down 419 basis points year-over-year.
At foreclosure auction, the bid-ask spread narrowed to approximately 909 basis points, down from 980 basis points last quarter but still wider than 708 basis points a year ago. Credit bid-to-value averaged 67.0 percent, down 21 basis points from Q4 2025 but up 345 basis points from Q1 2025.
Taken together with the buyer pricing demand data, those results suggest sellers were gradually adjusting pricing strategies in response to localized demand conditions rather than moving in a uniform direction.
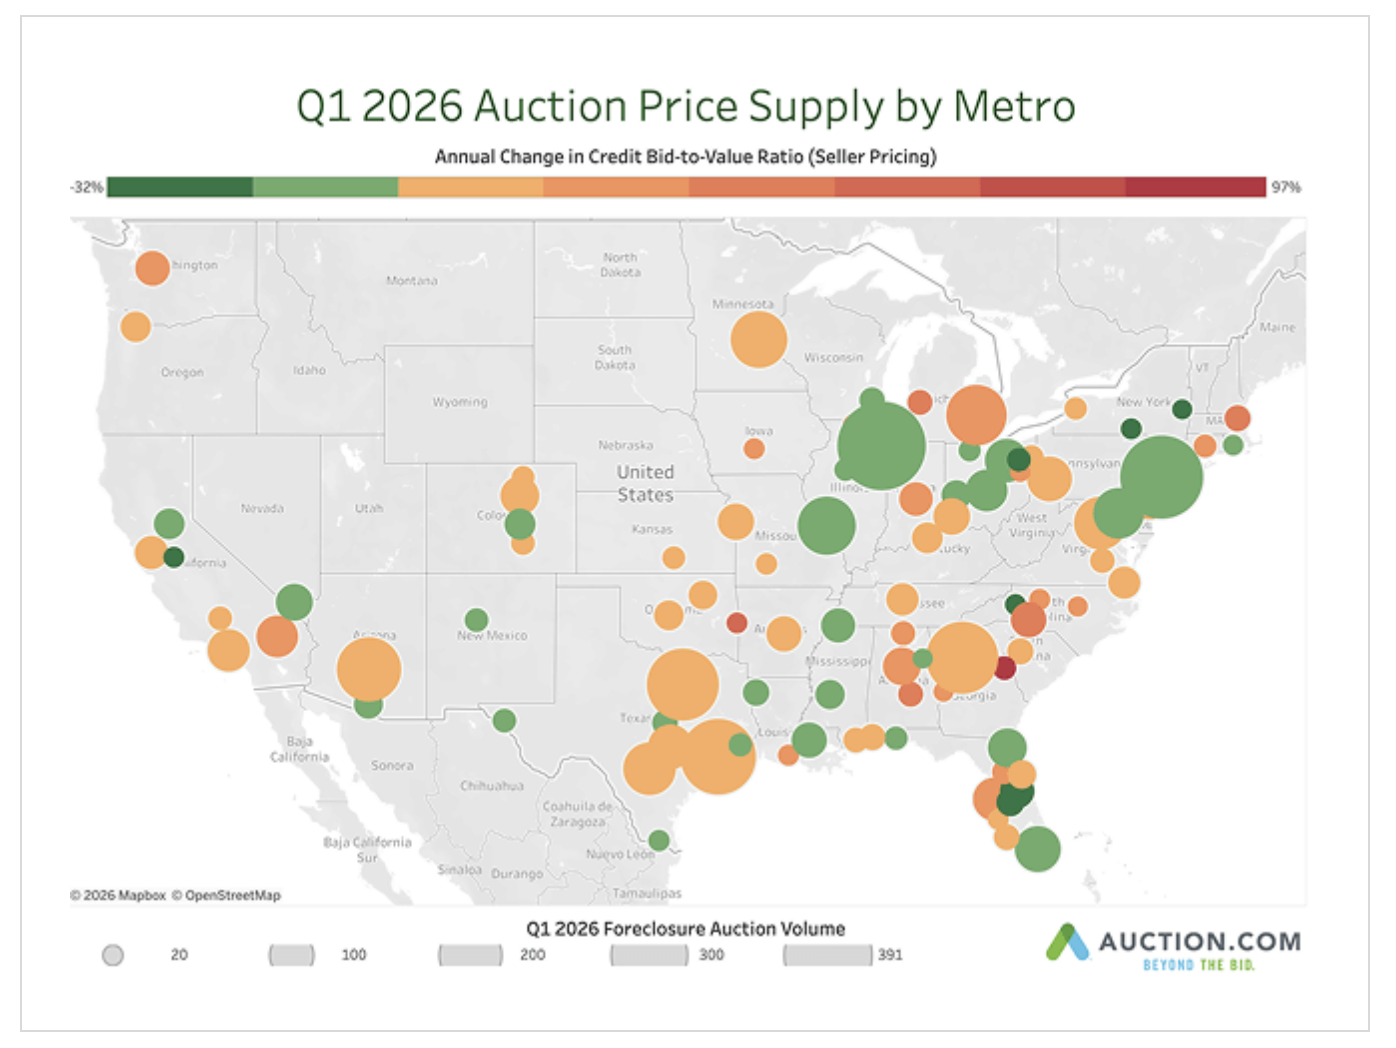
Sixty-two MSAs, or 64 percent, increased seller pricing from a year ago, while 35 MSAs, or 36 percent, reduced seller pricing, reflecting generally firmer lender pricing strategies. Among the highest-volume MSAs with rising seller pricing, Atlanta, Houston, Dallas, Phoenix and Tampa recorded increases ranging from roughly 1 percent to the low teens. Among the highest-volume MSAs with declining seller pricing, Miami, New York, Chicago, St. Louis and Baltimore posted year-over-year declines ranging from roughly 2 percent to nearly 12 percent.
The MSAs with the highest seller pricing levels in Q1 2026 included New Orleans, Ocala, North Port-Sarasota, Seattle and Cape Coral. The MSAs with the lowest seller pricing levels included Binghamton, Albany, Peoria, Buffalo and Milwaukee.


Leave A Comment