
Do you know your organization’s local, regional and national market share? Accurate volume data about the private lending market can be hard to come by. Yet it’s critical to know the size of your market if you want to raise capital, measure success or grow your business.
A desire to better understand our position in the Washington, D.C.- Maryland-Virginia metro area (DMV) led us to seek out ways to accurately measure market share. After much research, we thought we may have come up with a reliable method – a method you can use to benchmark your asset-based real estate lending market share as well.
Our industry’s uniqueness makes it challenging to analyze market share. We don’t have the standardization of the traditional mortgage market, where most deals flow through a handful of secondary market players who freely share loan-level, portfolio-level and industrywide data.
In our industry, deals flow through innumerable pipelines created by companies that raise and lend funds in different ways.

Two Ways to Measure the Market
To identify the total accessible market (TAM), you have two choices: bottom-up and top-down. Whichever you choose, once you’re finished, it’s important to cross-check your results with experts.
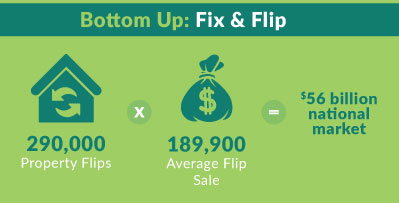
Fix and Flip Approach
As a bottom-up approach, we started with the number of flips reported in ATTOM’s 2016 Year-End U.S. Home Flipping Report. Culled from the public records in more than 1,000 counties, the ATTOM report covers the areas where roughly 81 percent of the U.S. population resides.
ATTOM counts flips as any property transaction, where the property was sold twice within a 12-month period.
By expanding the ATTOM data to represent the entire U.S. population totaling 296,400 property flips in 2016. That’s 5.7 percent of all existing home sales.
For 2016, the median priced flip sold for $189,900, meaning that the TAM for flipping purchases in 2016 was $56 billion.
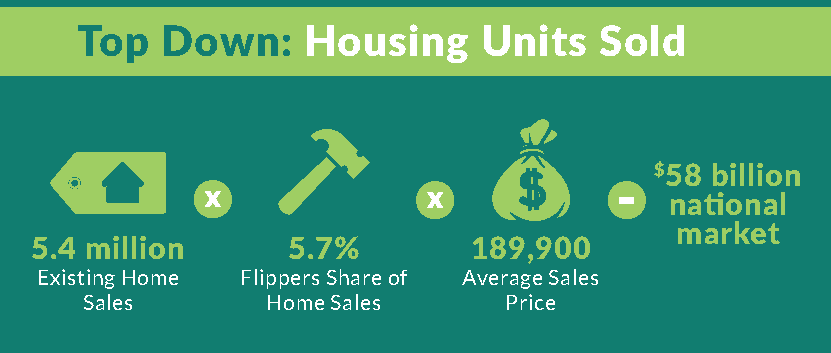
Housing Units Sold Approach
To use a top-down approach, we start with total sales of existing U.S. homes in 2016. Opinions do vary when it comes to exact numbers. Here are estimates of annual home sales from four sources:
- ATTOM 5.2 million
- NAR 5.4 million
- NAHB 5.5 million
- MBA 5.5 million
If we accept the average estimate as 5.4 million homes sold in 2016, then apply ATTOM’s estimate that 5.7 percent of those homes were flipped and the $189,000 sales estimates, we get a TAM of $58 billion.
How Much of the Fix and Flip Market is Financed?
Whether we take a top-down or bottom-up approach, the final estimates are relatively close. Since most private money lenders generally base their loans on after-repair values (although we certainly take as-is value into account), we can use that $56 billion to $58 billion sales figure as a starting point to calculate total loan volume.
ATTOM estimates flippers financed 31.5 percent of 2016 deals nationally. ATTOM’s senior vice president, Daren Blomquist says the 31.5-percent figure comes from counting all cash sales in the mortgage data collected as part of the company’s “deed and recorder” dataset.
Applying that data point to our $56 billion to $58 billion TAM estimates gives us a financed TAM of between $17 billion and $18 billion.
However, that number is low. Many borrowers write “cash sale” on a contract to get the deal, then arrange some type of alternative – private money – financing to close.
The ATTOM data also shows significant annual and state-level variations in the proportion of deals financed, which would influence TAM as well.
Private Lending’s Share
How much of the money borrowed to flip houses comes from private money lenders versus traditional mortgage loans?
Much of this funding could be coming from our industry. Generally speaking, private money lenders are more flexible and move faster than traditional lenders because they are set up to quickly assess the asset backing the loans.
Some banks are relaxing their lending standards to lend more money to real estate investors. However, private money lenders’ speed, flexibility and market knowledge enable them to beat out the banks. Especially in markets where property inventory is shrinking in turn raising competition for the remaining properties.
So far, all the data considered is centered around fix and flips. Although many private money loans do fund fix and flips, borrowers also use private money for bridge loans, construction loans, land acquisition, development and short-term refinances.
Mortgage Debt Origination Approach
Another way we can view this challenge – and double-check our estimates – is to consider the flipping portion of the overall annual mortgage origination market. The Mortgage Bankers Association (MBA)’s Finance Forecast put 2016 total mortgage debt originations at $990 billion.
We asked several experts in the banking and private lending fields about the percentage of mortgage originations they thought were achieved with private money. Thosestimates, received from venture capitalists, crowdfunders and traditional hard money lenders, ranged from 0.5 percent to 5 percent.
A selection of factors the sources considered:
- Banks have loosened underwriting requirements to accommodate real estate investors.
- The nonprime lending market is re-emerging after dropping off post Dodd-Frank.
- Bank offerings now include products that compete with private money loans.
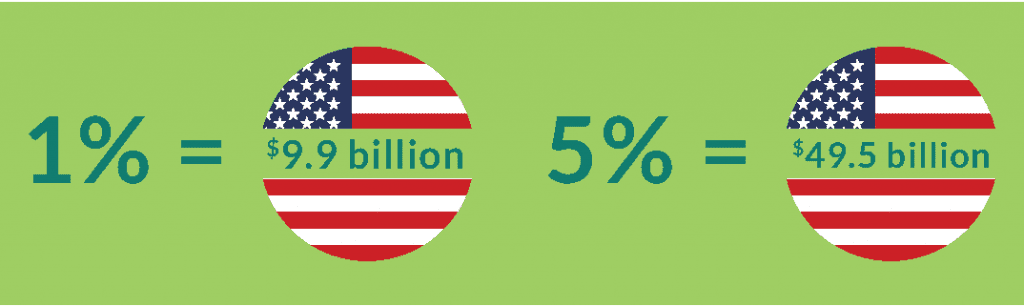
If we use a conservative estimate that private money loans were equal to 1 percent of all mortgage originations, that equals $9.9 billion for the size of the private lending market in 2016. A more aggressive estimate of 5 percent puts the TAM at $49.5 billion.
This method gives us a large range, but it shows $58 billion to $59 billion TAM estimates aren’t too far outside of the ballpark.
How to Calculate Your Regional Market Share
Remember, we started this process seeking an accurate measure of progress in the DMV. To do the same thing in your market, you can follow this strategy for funneling those national figures into the local market.
- We began with a few data points:
- Census data: 1.9 percent of the U.S. population lives in the DMV (6 million/320 million)
- Existing home sales: 7 percent of nation’s home sales occurred in the DMV (93,000/5.4 million)
We’ve agreed the number of 2016 flips nationally was 296,400 in 2016.
- 296,400 x 1.7 percent = 5,039
- 296,400 x 1.9 percent = 5,632
We rounded up the number for the DMV to 6,000 because we’d rather go high than go low and underestimate the size of our market, making it look like we’re doing better than we are.
- To calculate the lending volume generated by those 6,000 flips, we had to adjust the data to reflect the relatively high cost of housing in the DMV.
- We used a 1.68 percent multiplier to reflect the ratio of the DMV’s median existing home price to the national median price.
We’ve agreed the cost of each flip nationally was $189,900. Applying a 1.68 percent multiplier to the 6,000 flips gives us $1.9 billion in local TAM.
You can refine the data even further by considering ATTOM research that shows the rate of flips and the rate of financed flips by ZIP code.
Many of the DMV’s ZIPs have a higher-than-average rate of flips (compared to the U.S.) as well as a higher than average rate of financed flips.
Taking those factors into account pushes the DMV’s potential TAM to more than $2 billion in 2016.
Using U.S. Census, NAR and ATTOM data, you can determine the TAM for the ZIP codes where you lend, or any ZIP code in the country, helping you plan where to expand your business.
The intent isn’t for this to be the last word on the size and scope of the fix and flip and private lending industries. Rather, we look at this as the beginning an ongoing conversation about our space.
In tackling this challenge, it was determined that the most effective methodologies, compiled reliable data from a variety of trusted sources, analyzed and cross-checked that data, added critical thinking gained from decades of real world experience in the construction, flipping and lending industries and drew reasonable, well-supported conclusions.


Leave A Comment