
Lightning Docs, the official loan documents and loan document platform of the American Association of Private Lenders (AAPL), recently shared updated annual bridge and rental loan data that shows the current state of the private lending industry.
Since 2018, Lightning Docs has tracked data for more than 54,000 loans at an aggregate of $29.7 billion, using information generated from users of its platform. During an average month, Lighting Docs sees about 200 users, more than 2,000 loans, and more than $1 billion in loan volume. In February, Lightning Docs released annual data for 2023, breaking down interest rates and loan volume for both bridge and rental loans.
The updated annual data confirms that 2023 did not turn out to be as bad a year for the private lending industry as some forecasters were initially concerned it would be. Overall, after a rough January and February, most markers of the industry arced up in March and then remained at a plateau for the remainder of the year.
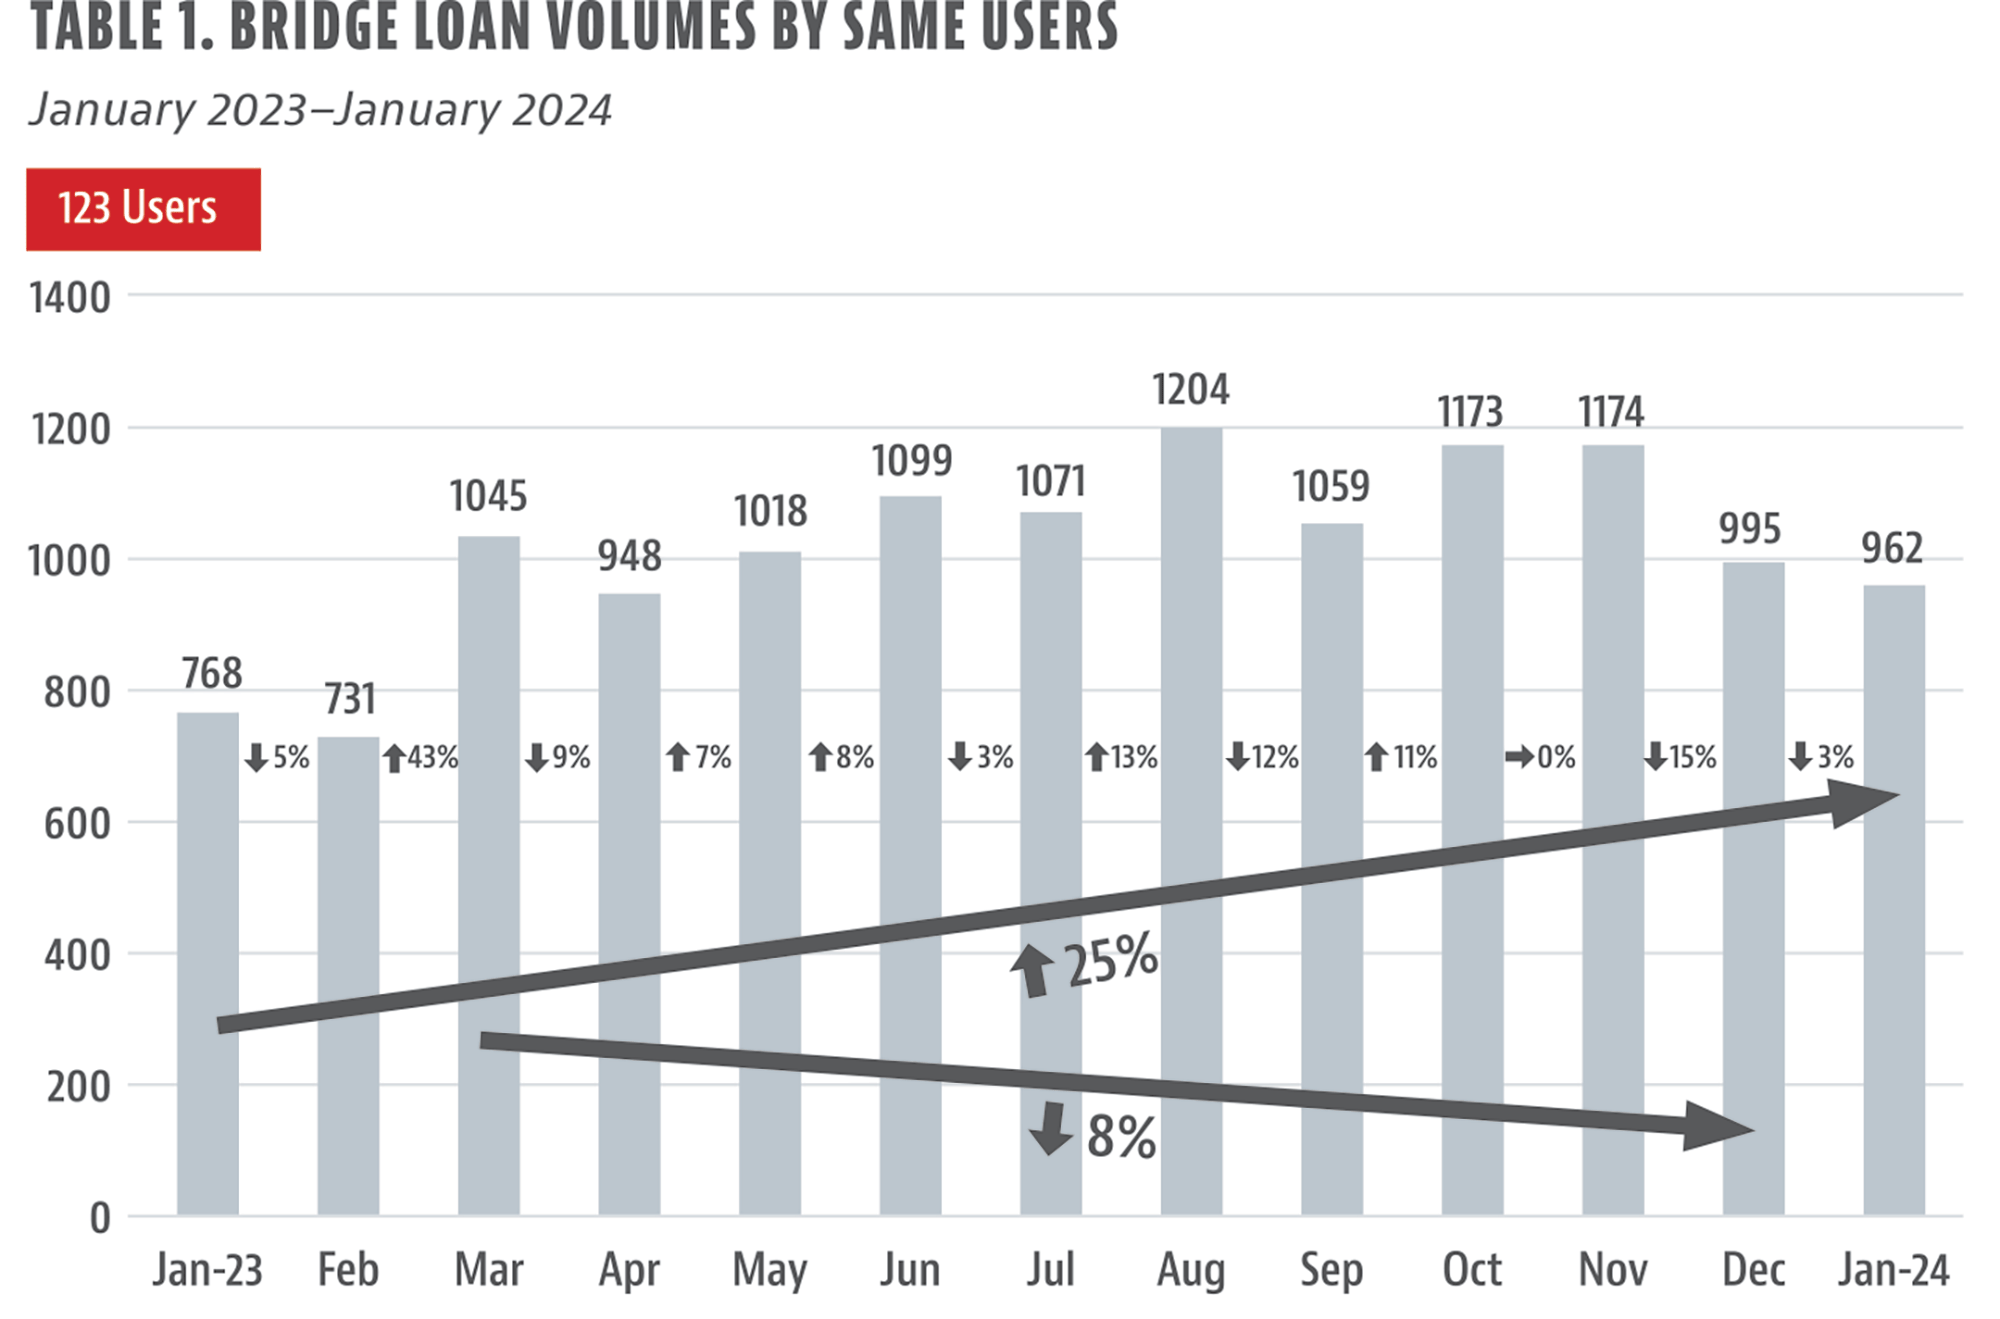
Bridge Loan Volume Up by 25%
For our purposes, we are defining a bridge loan as an interest-only, short-term loan of 36 months or less that can be used for fix-and-flip projects, construction, including ground-up, or as a short-term financing mechanism with no construction (i.e., a true bridge). When we tracked the same pool of 123 users who used the system from Jan. 1, 2023, the data showed loan volume increased by 25% from January 2023 to January 2024 (see Table 1). Viewed from March 2023 to December 2023, volume was down by 8%, reflecting the plateau effect we saw across the board with seasonality decreasing from December through February annually.
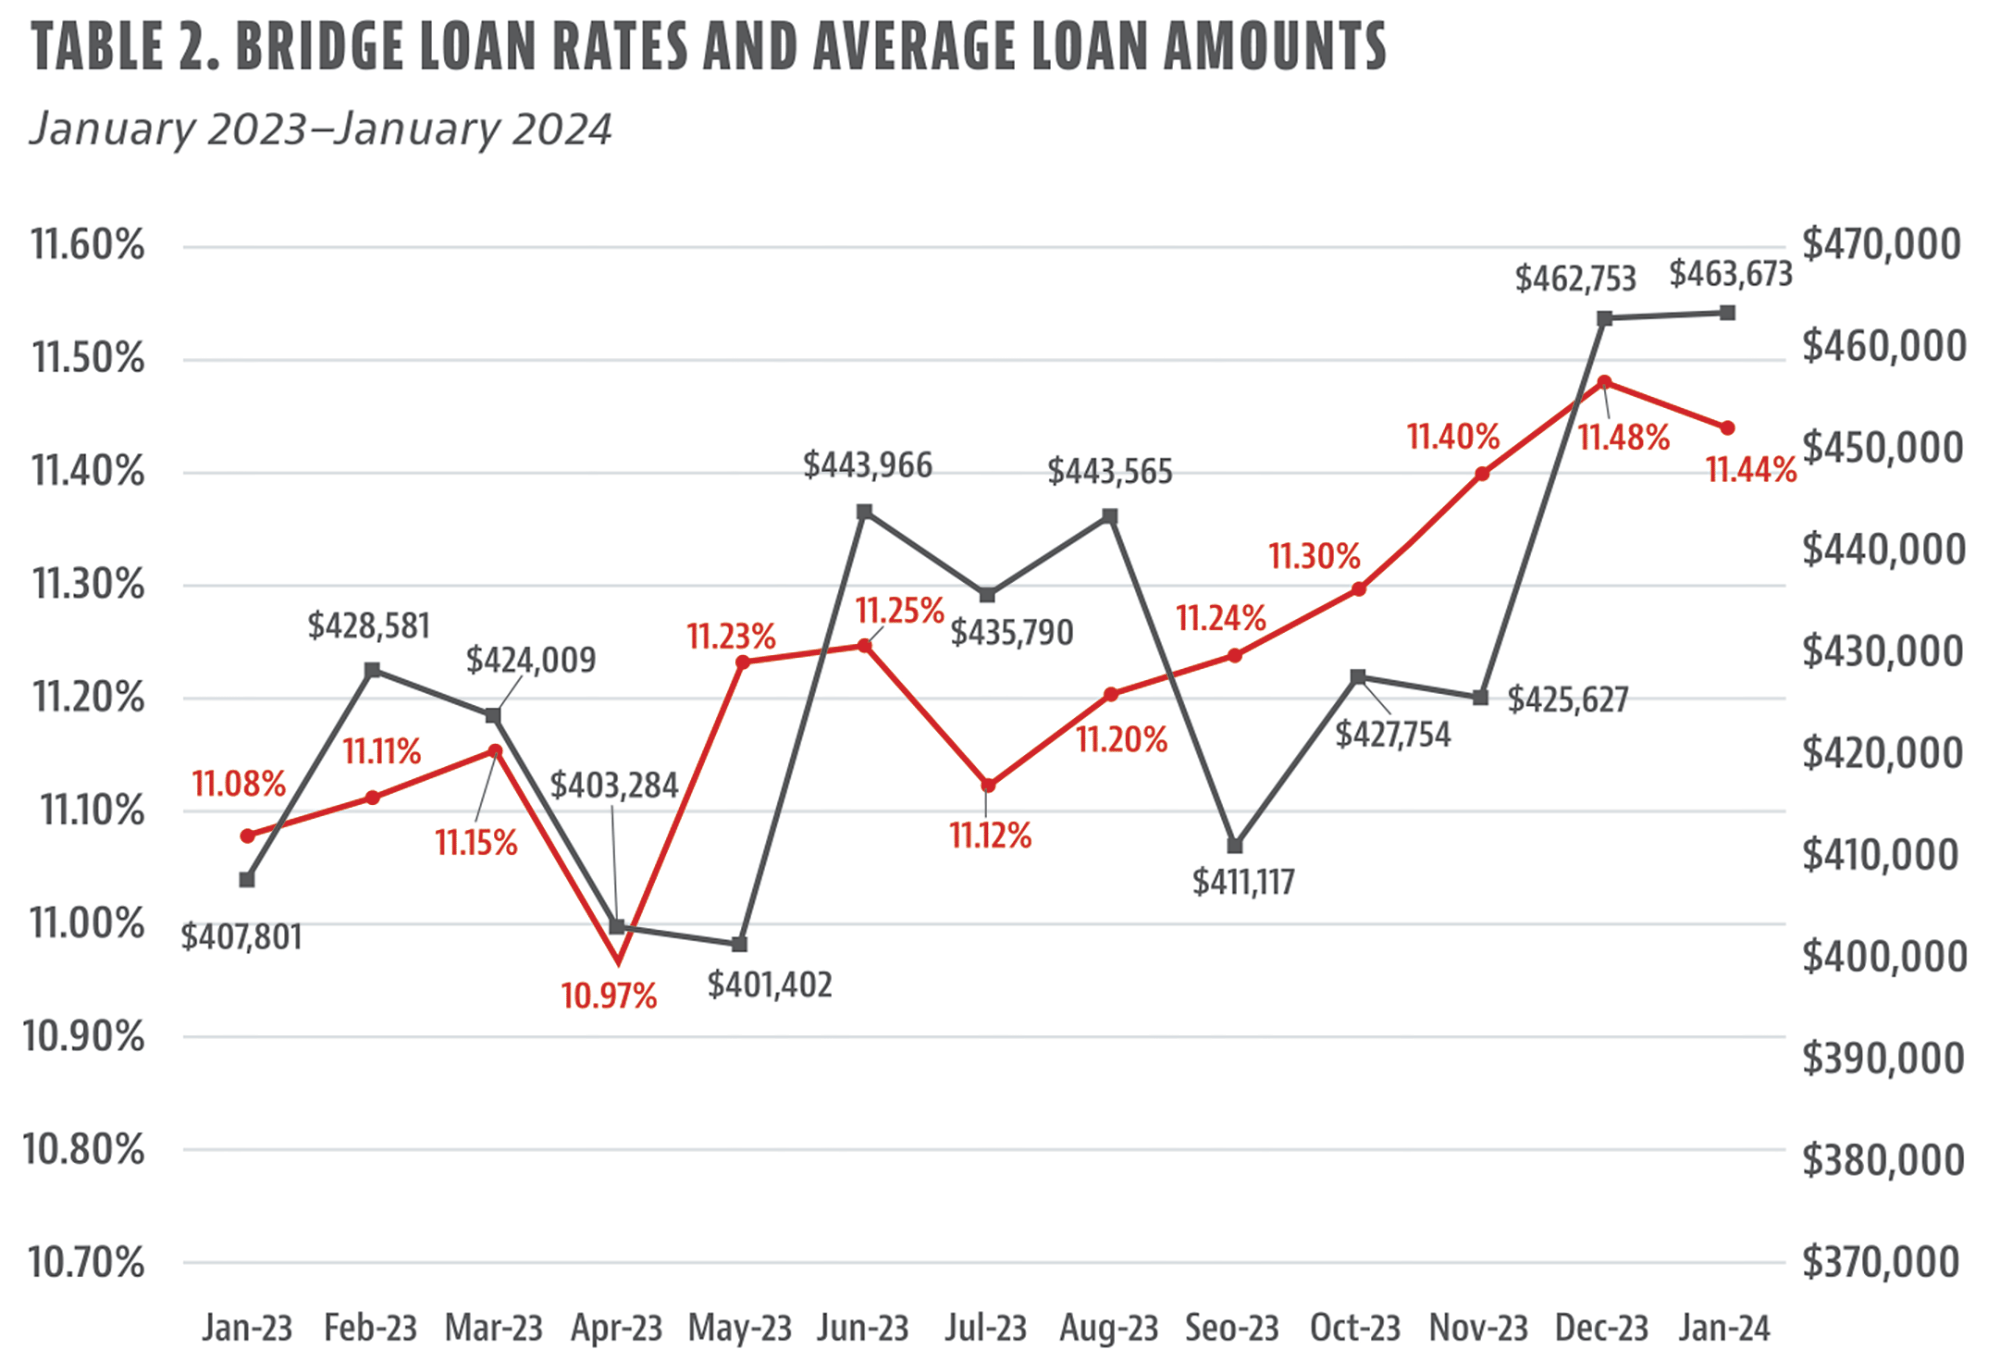
Bridge Loan Interest Rates Hold at 11%, Loan Volume Increases
The national average for interest rates for bridge loans last year stayed within 11%, starting at 11.08% and reaching a low of 10.97% before steadily cresting upward to 11.48% by December. Average transaction sizes stayed mostly flat throughout the year, ultimately increasing slightly, starting at $407,801 and then dipping to a year-low of $401,402 before gradually climbing to a high of $462,753 at the end of the year (see Table 2). To ensure meaningful results, we excluded outlier interest rates below 4% or above 15% and any loan amounts over $2 million or less than $50,000.
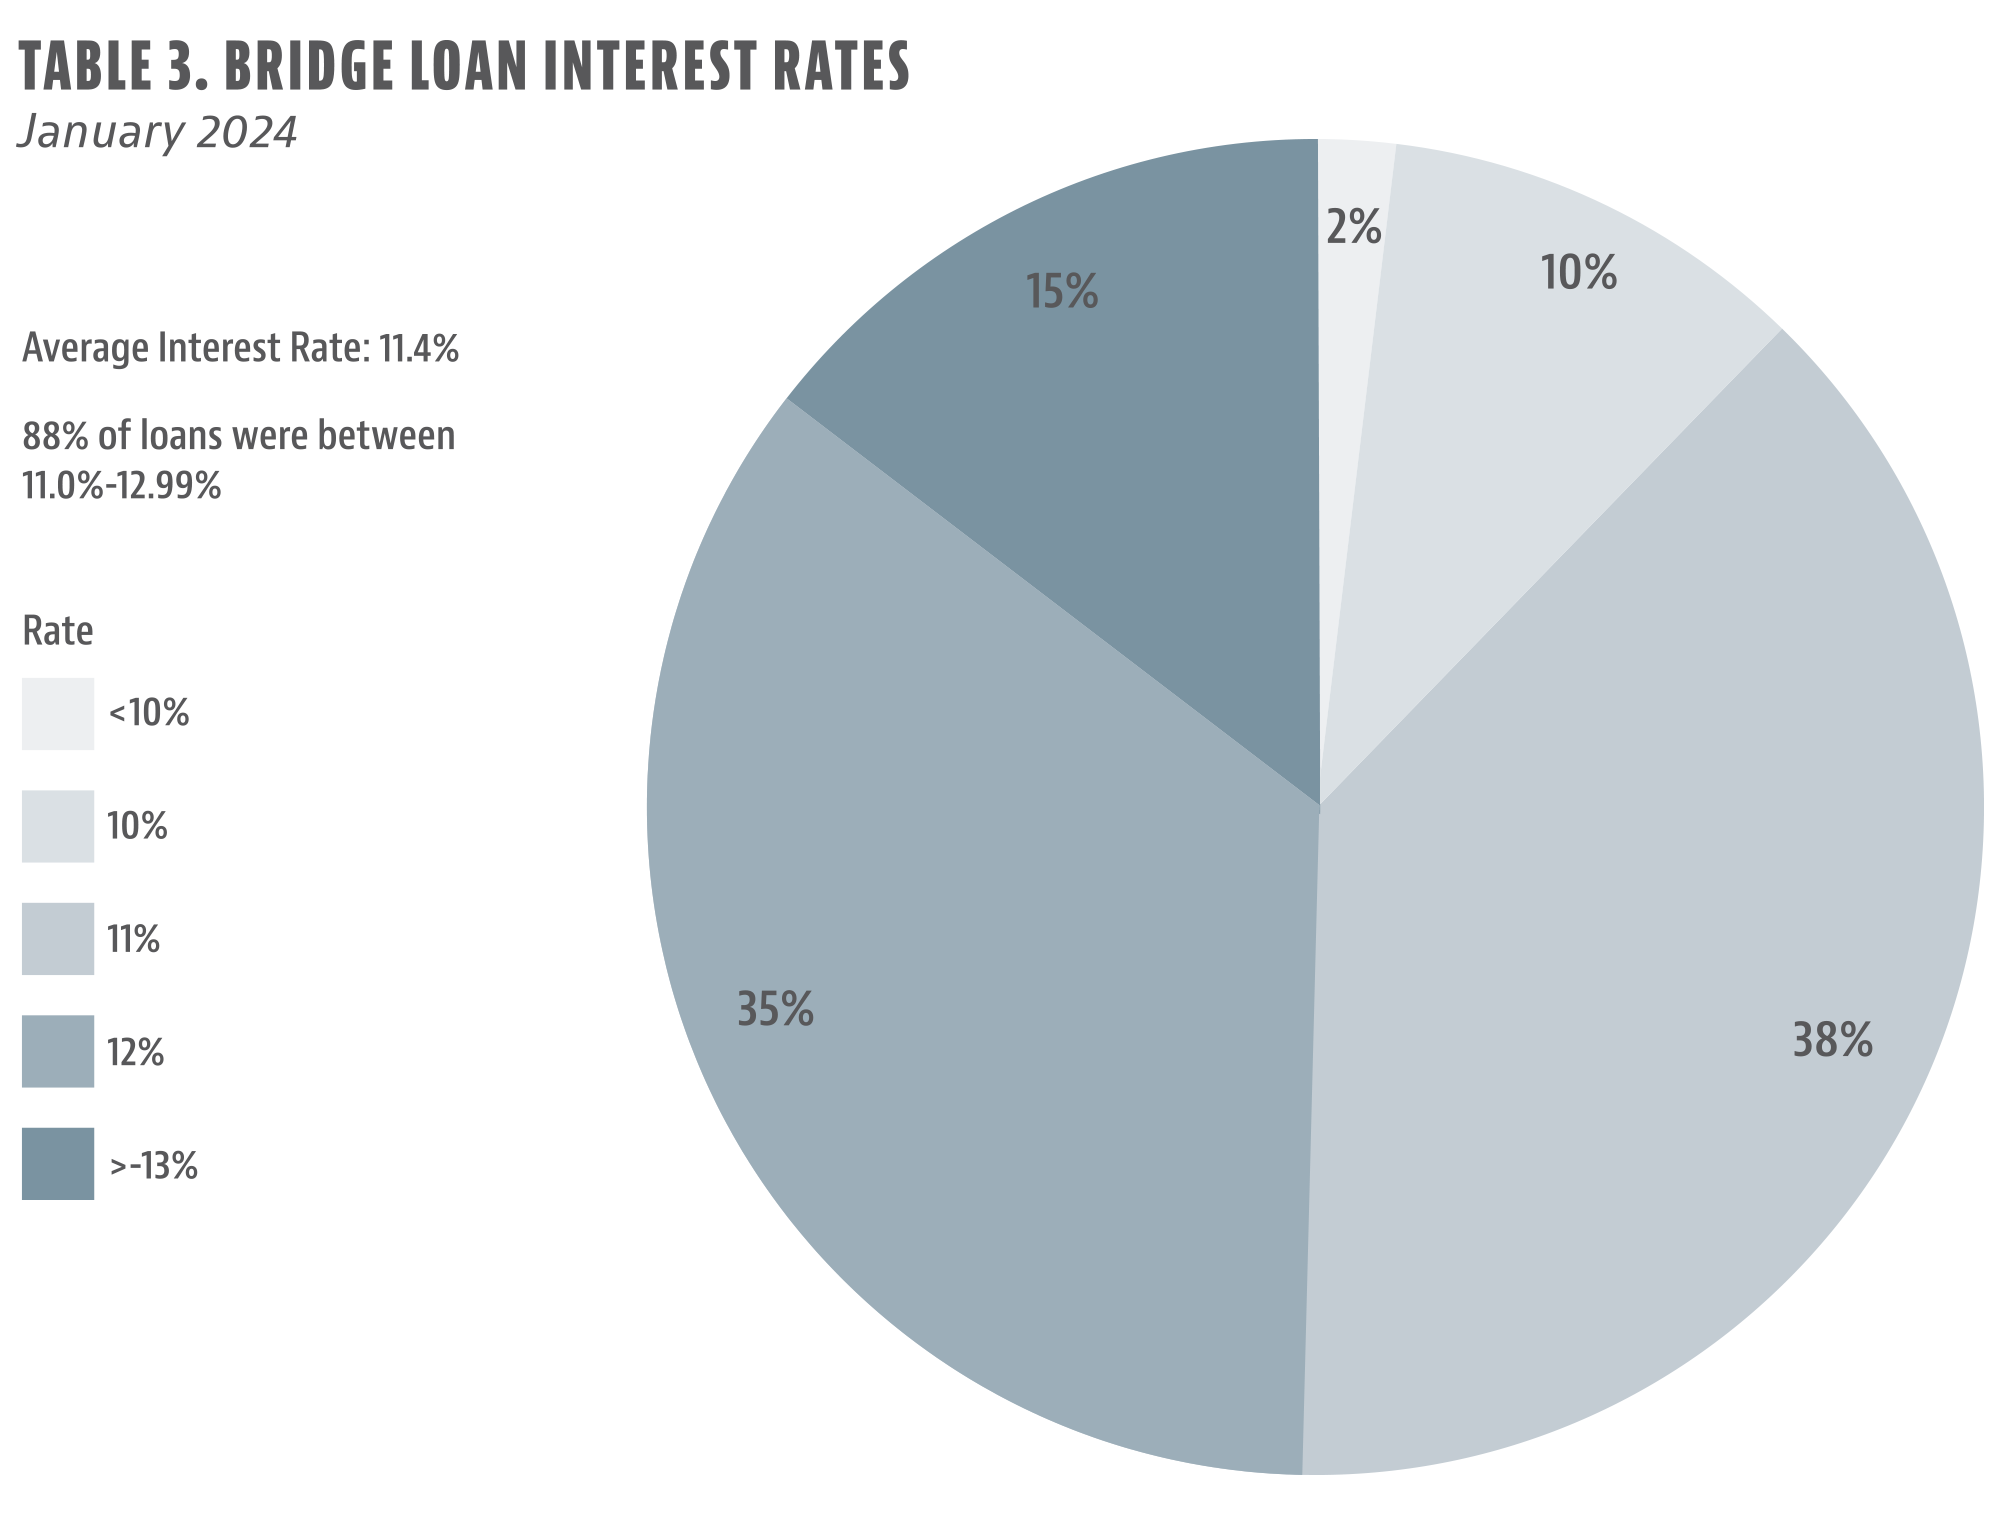
Behind the national average is a broad range of actual interest rates. Our data shows that 38% of loans actually went for an 11% to 11.99% interest rate while 35% were at a 12%-12.99% rate. At the other end of the spectrum, a 10th of loans were at 10-10.99% (see Table 3).
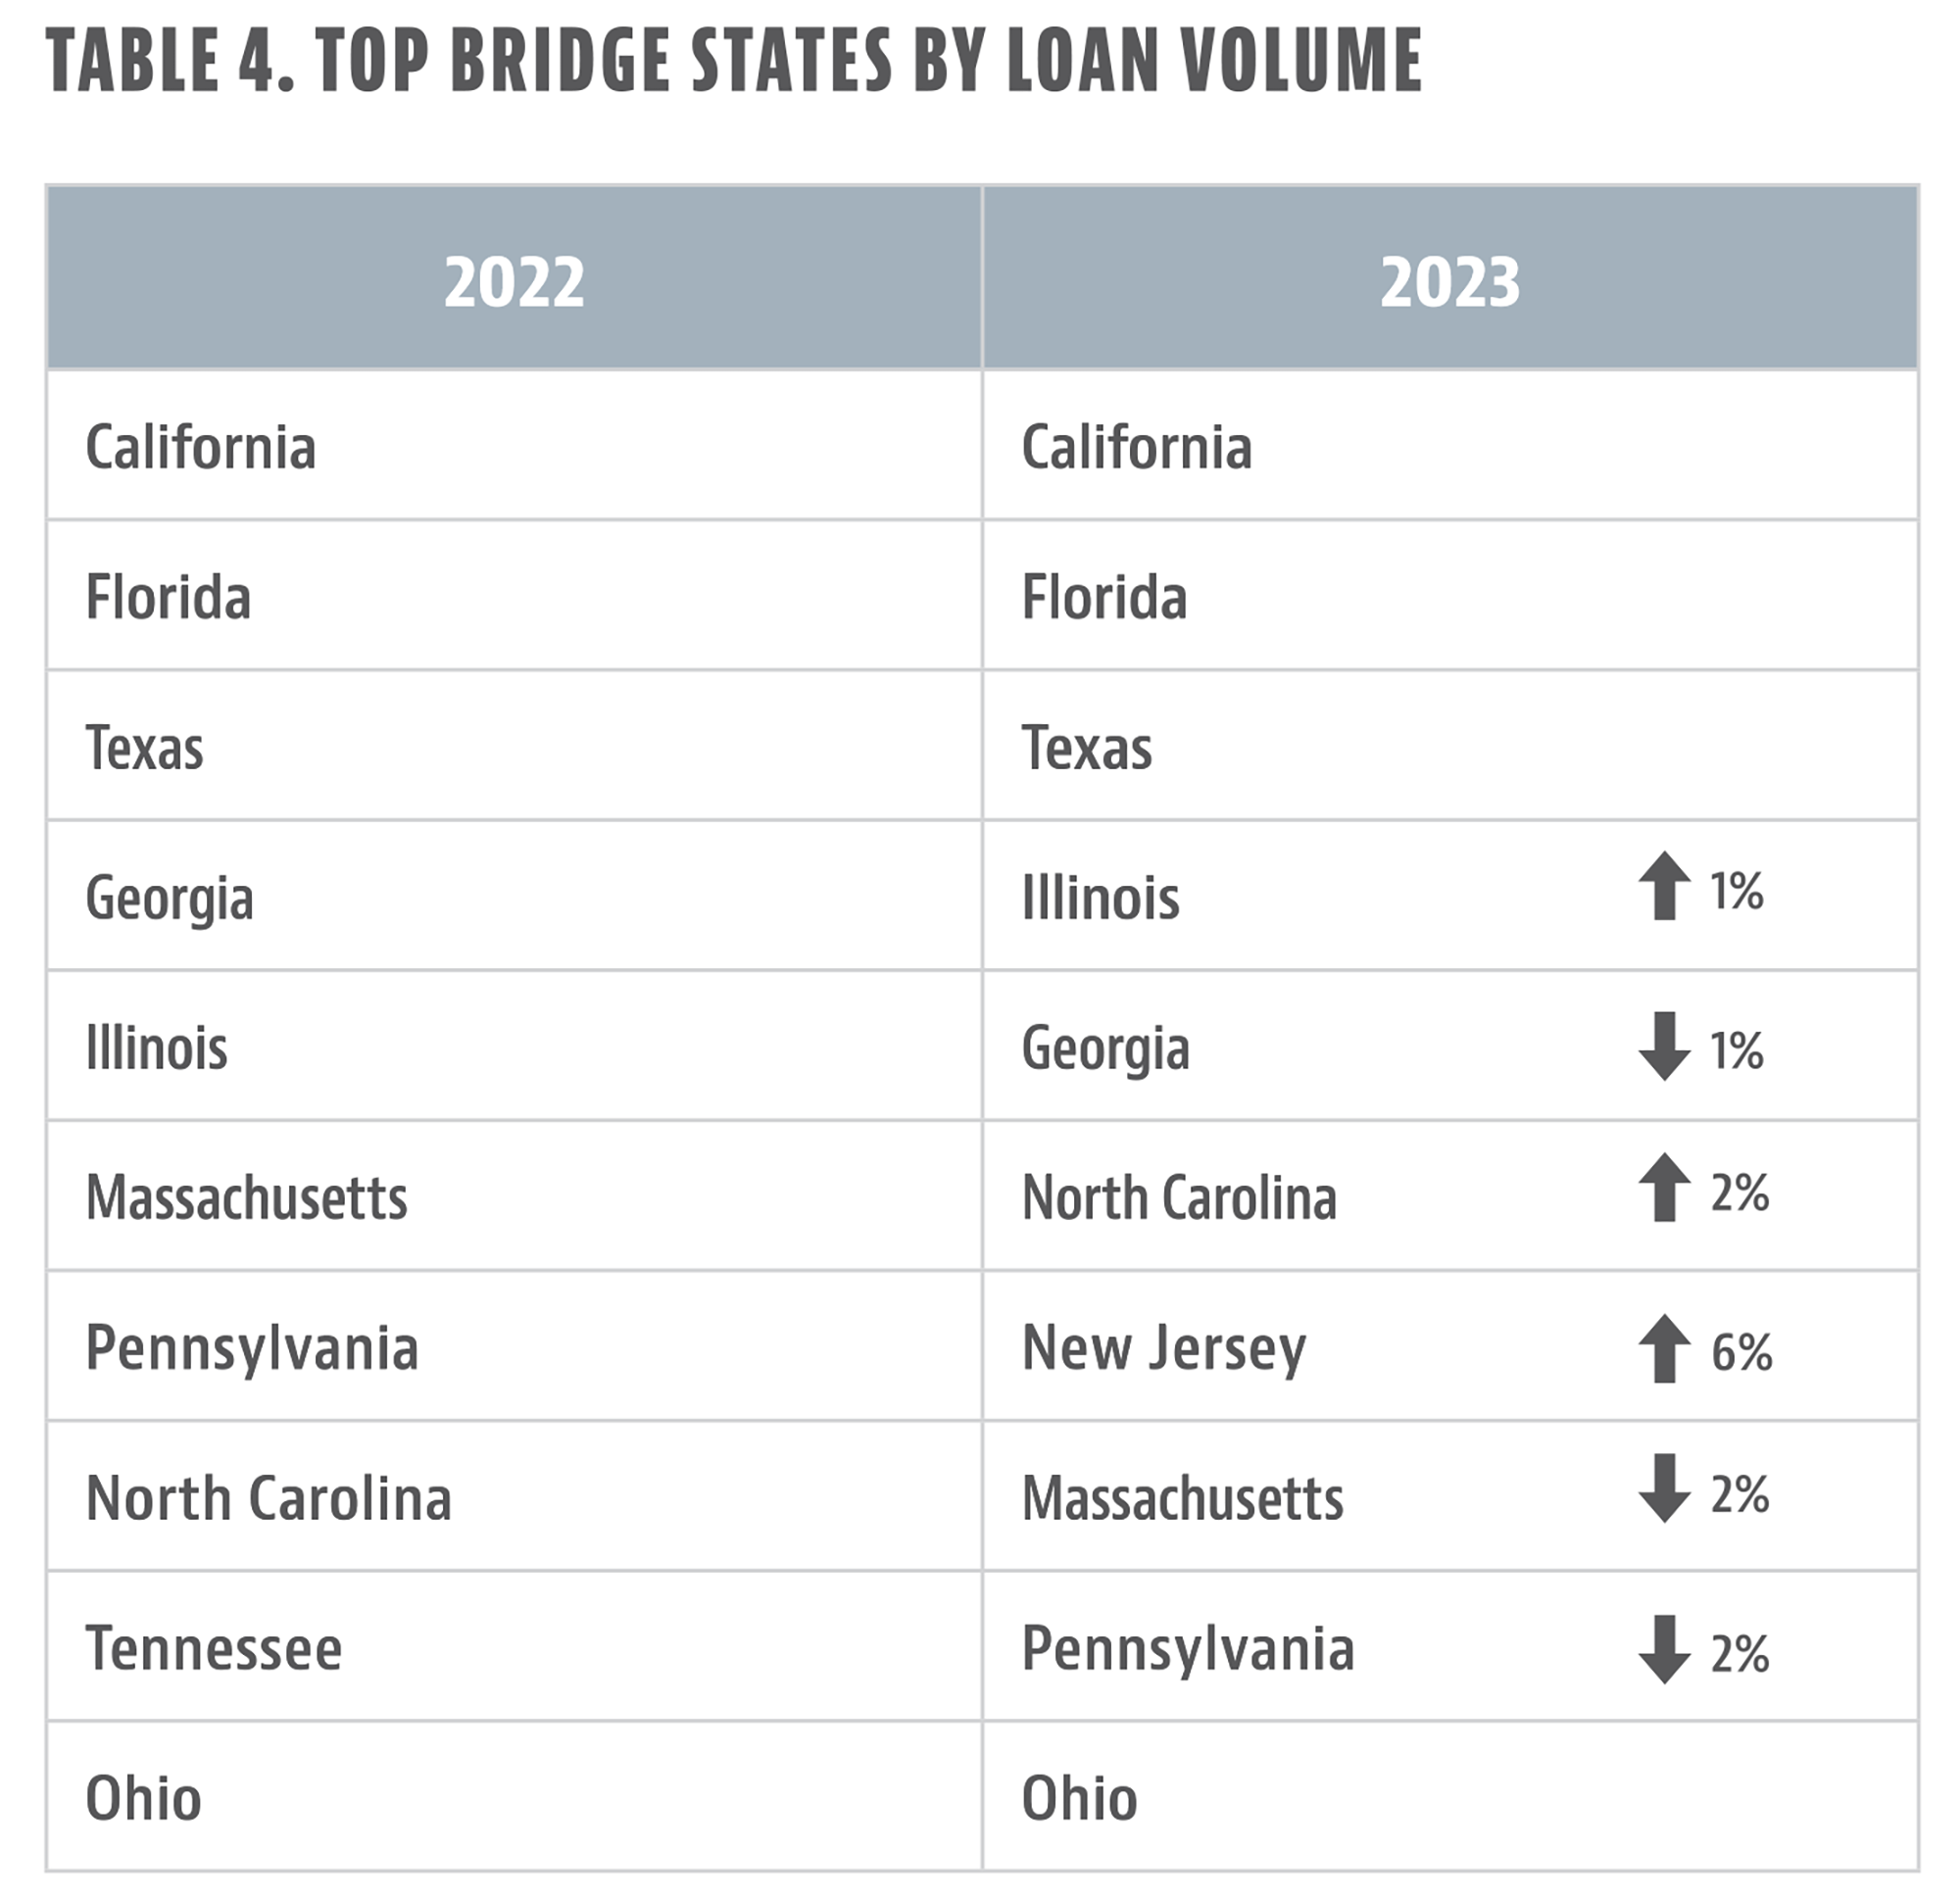
Between 2022 and 2023, California, Florida, and Texas remained the top three states in terms of loan volume (see Table 4). Massachusetts dropped lower, while New Jersey moved into the top 10, which is surprising because of the state’s onerous foreclosure process and meaningfully lower average interest rates.
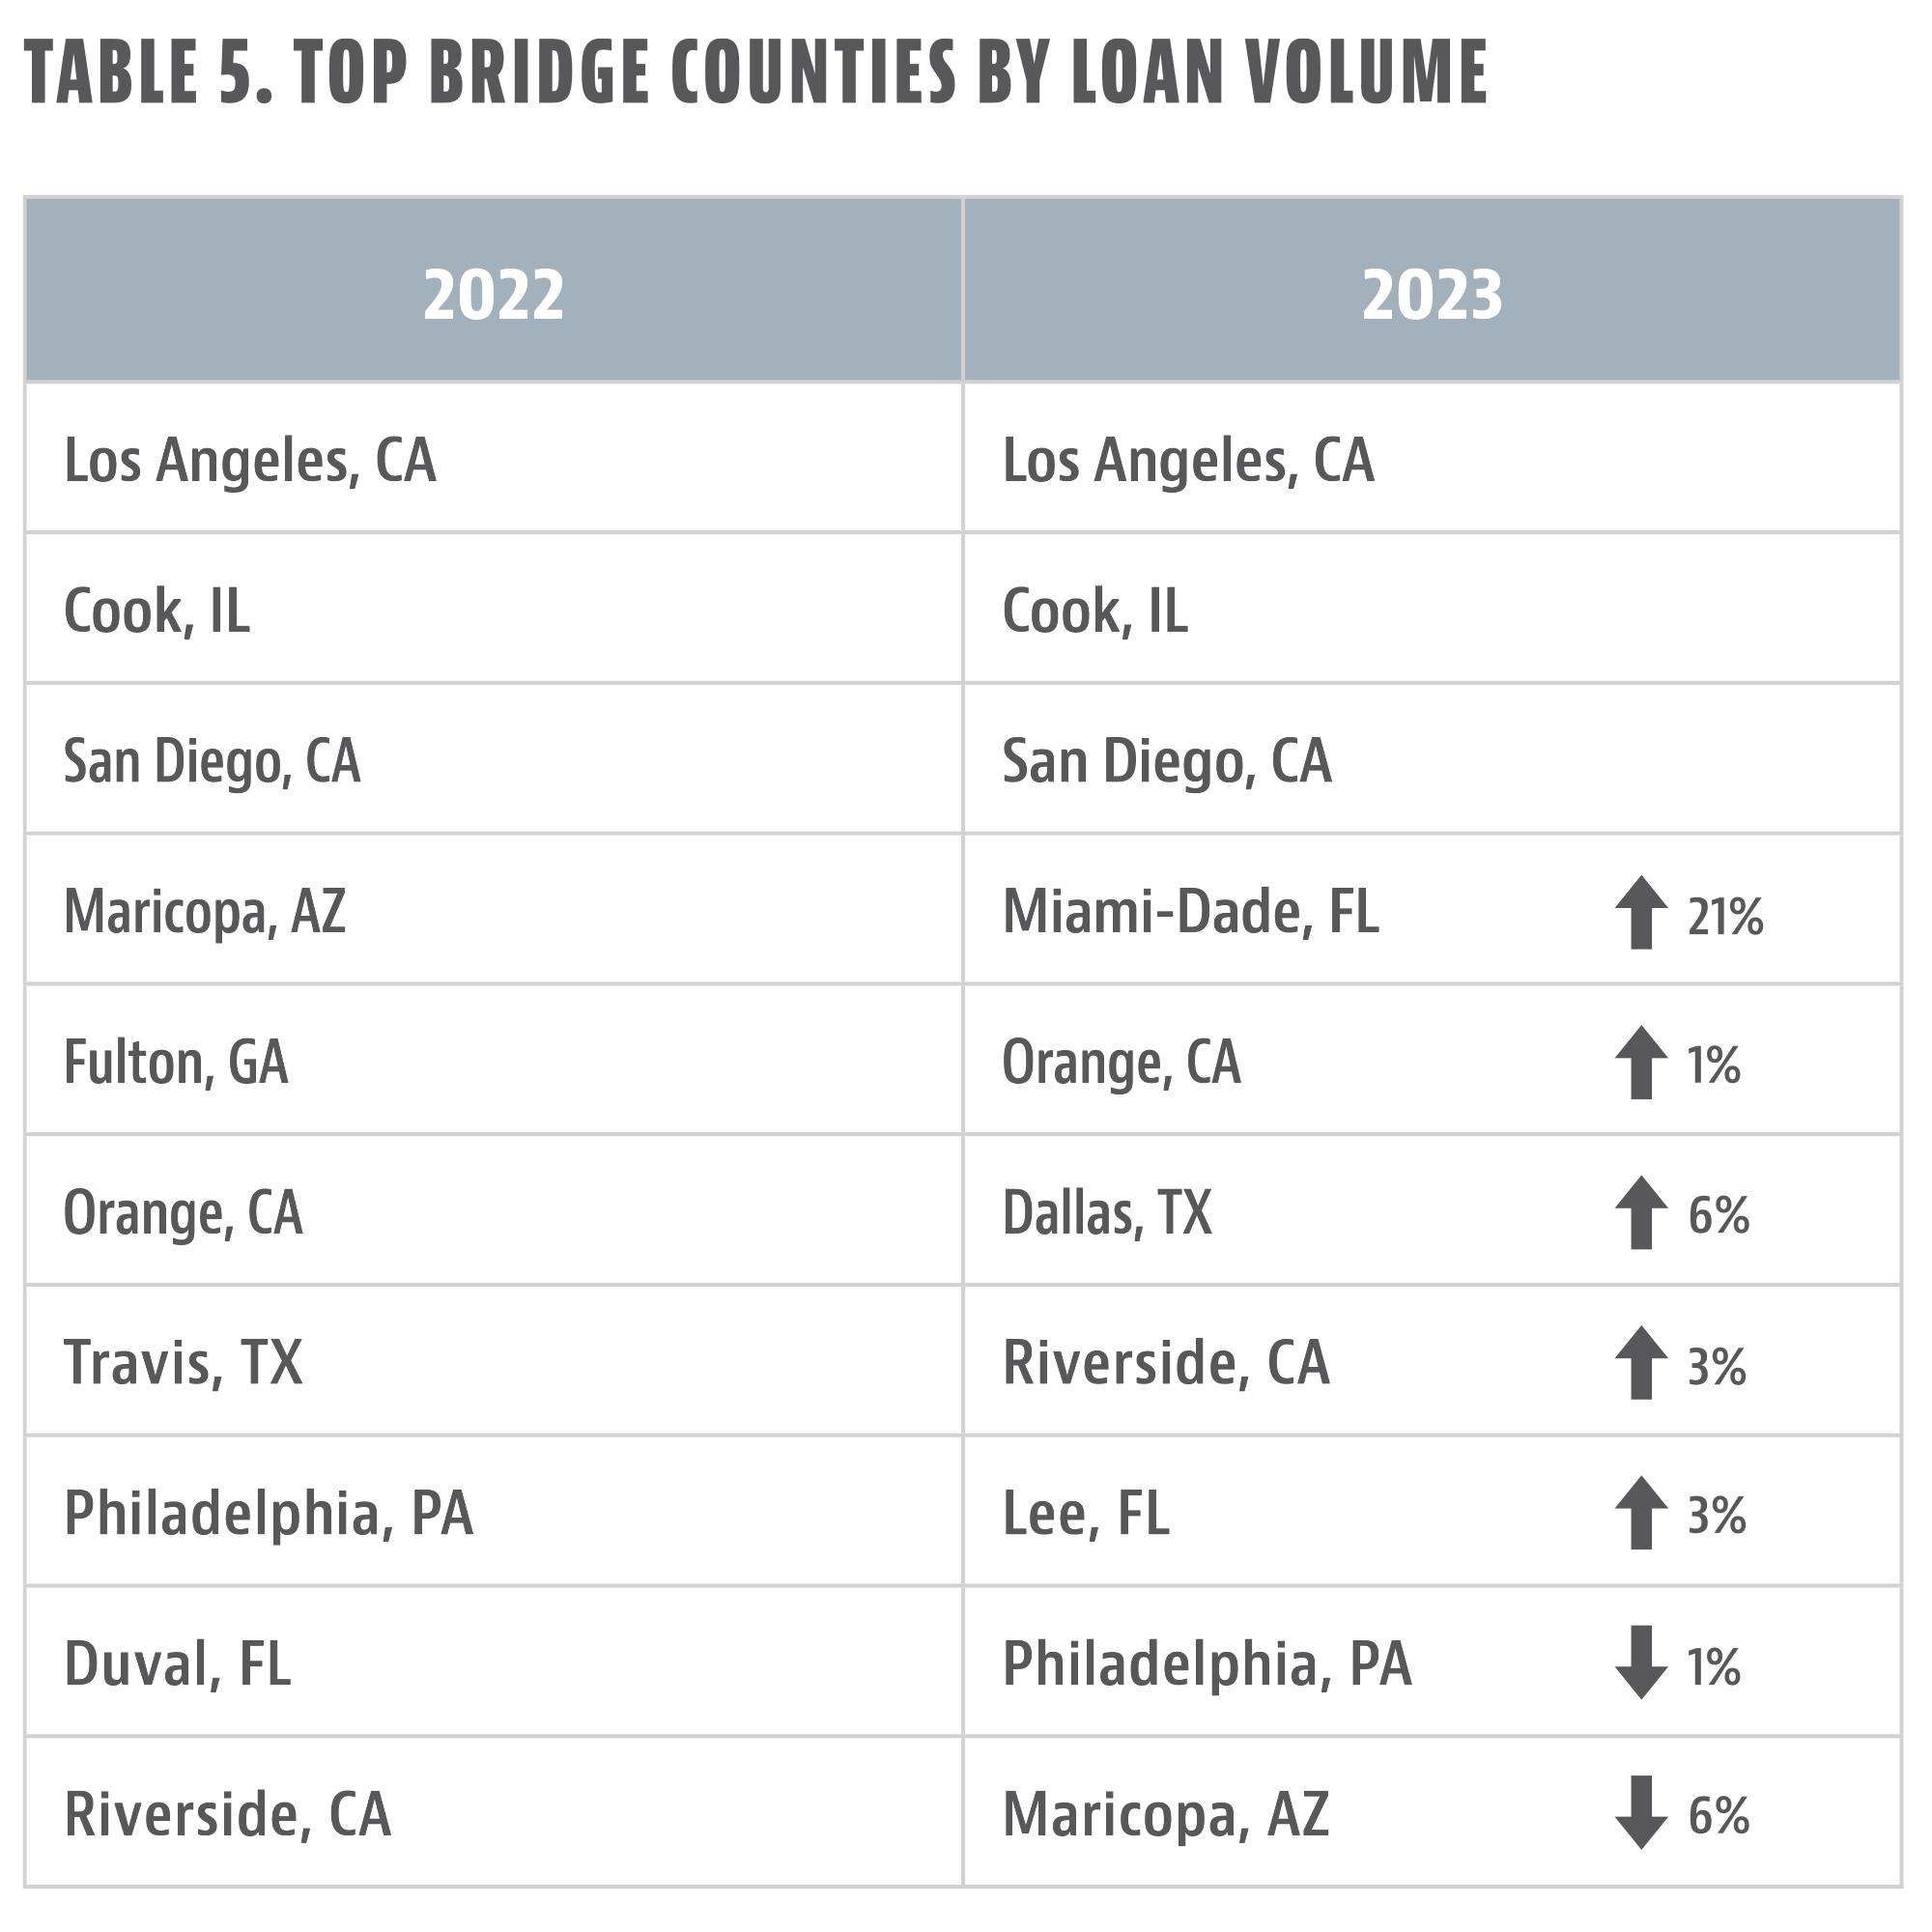
Given that bridge loans are intensely local business, we also take a look at loans at the county level from year to year (see Table 5). The top three counties for loan volume likewise retained their top spots—Los Angeles, California; Cook County, Illinois; and San Diego, California—while other counties saw dramatic movement. Maricopa, Arizona, plummeted from fourth to 10th place, while Miami leapt by 21 spots, landing in fourth place.
Term Rental Loans Show Steady Increases
What we describe as term rental loans are 30-year DSCR (Debt Service Coverage Ratio) loans. In 2023, the trend lines for these loans reflect what we saw with bridge loans. From January 2023 to January 2024, the rise in loan volume is even more pronounced, with an increase of 46%, based on our sample of 34 users (see Table 6).
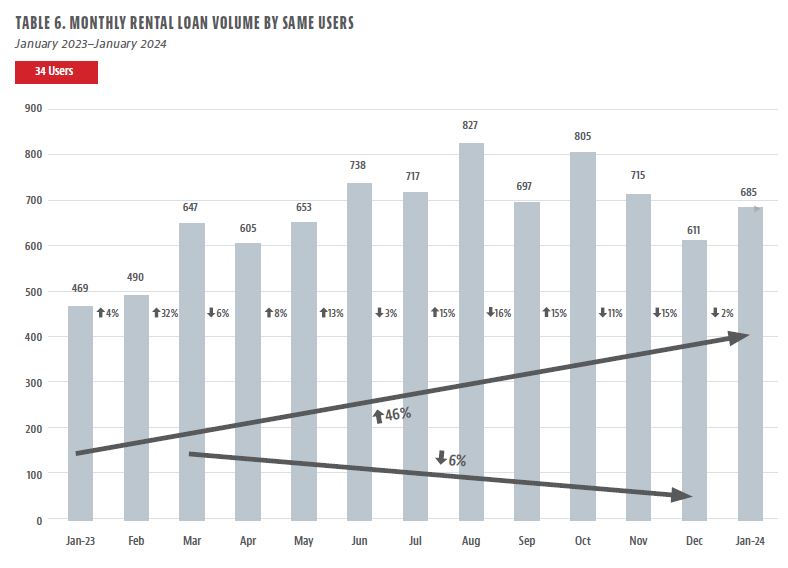
The biggest monthly jump—32%—occurred in March. For the remainder of the year, there were moderate ups and downs on a month-to-month basis but no massive sea change. When viewed from March 2023 to December 2023, the trend for term rental loans followed the same pattern as bridge loans, flattening out and ending with a loan volume slightly lower by 6%. (We used similar limits to exclude outlier interest rates and loan volumes.)
Term Rental Loan Interest Rates Show More Significant Change
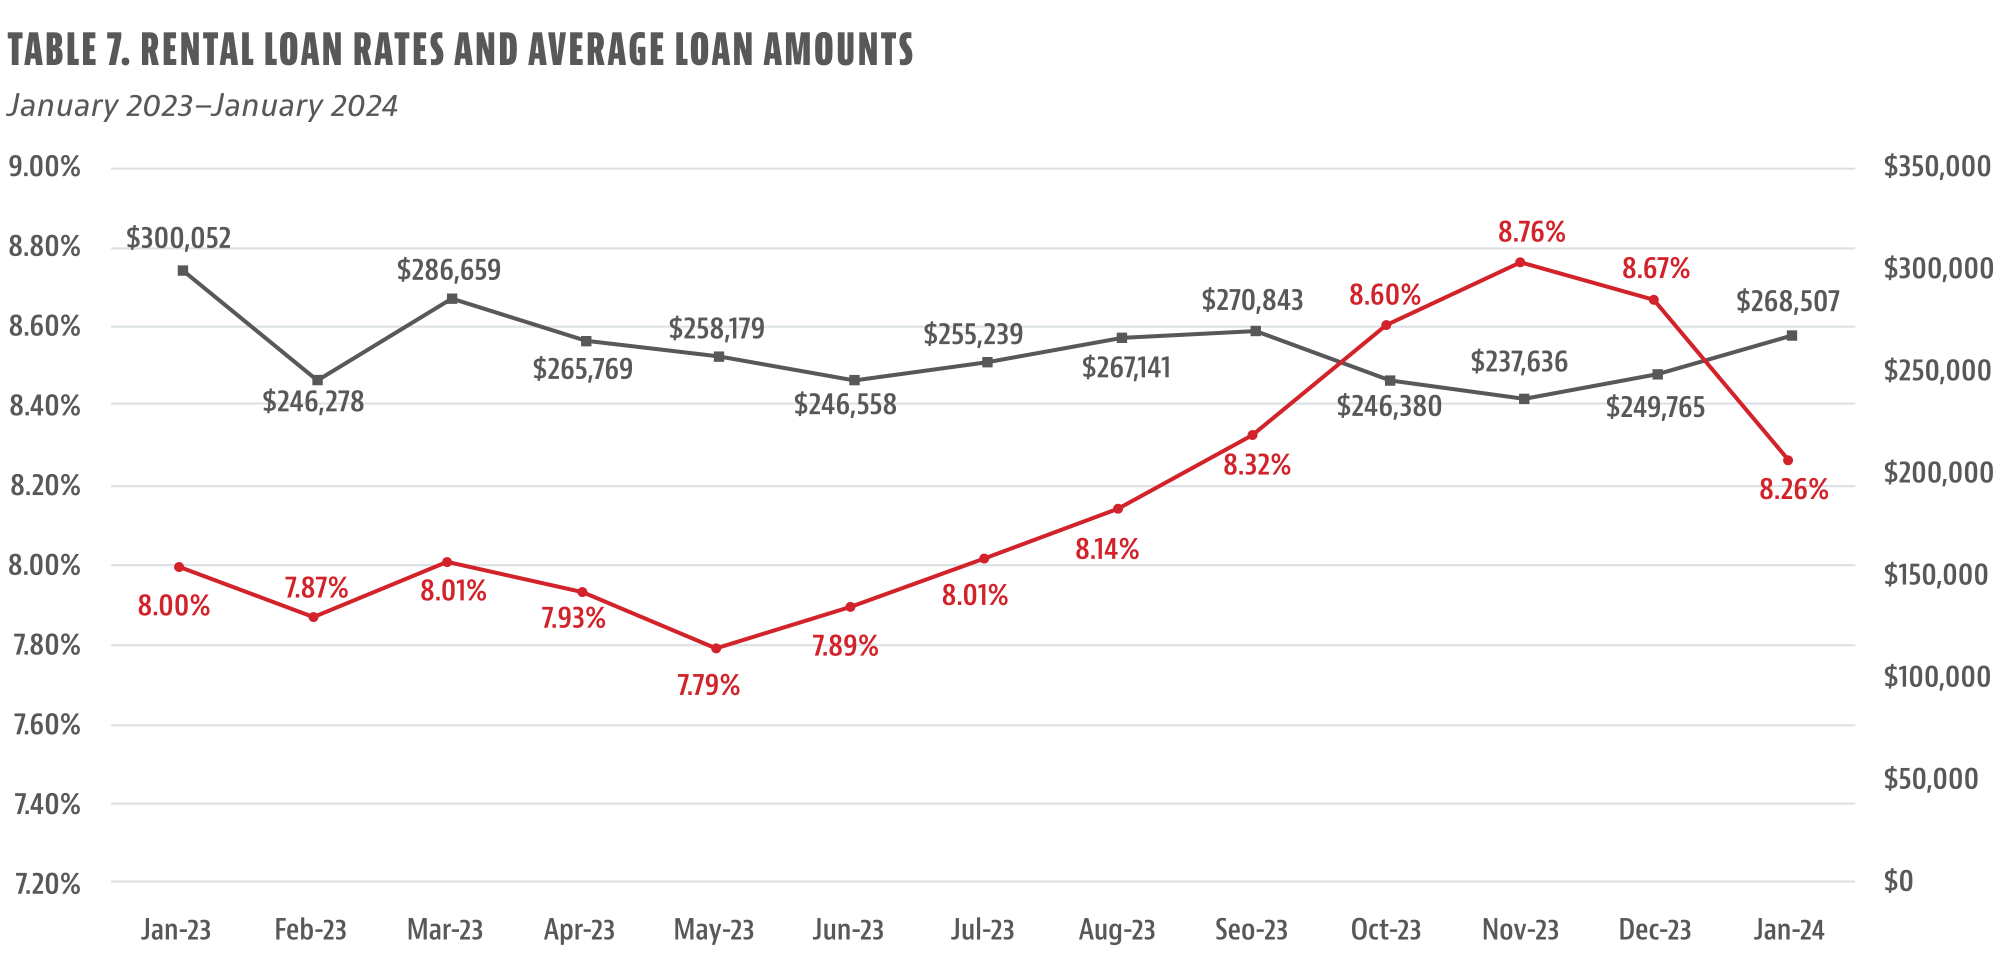
Unlike bridge loans, the national average for interest rates for term rental loans saw more of a swing, from a low of 7.87% in February to a peak of 8.76% in November last year (see Table 7). Loan volumes hit the highest point at the start of the year, at an average of $300,000 in January, before dipping to their lowest in the following month, at $246,278. After a spike in March, the changes in loan volumes evened out, with a series of upward and downward drifts, closing out at $249,765 in the final month of last year.
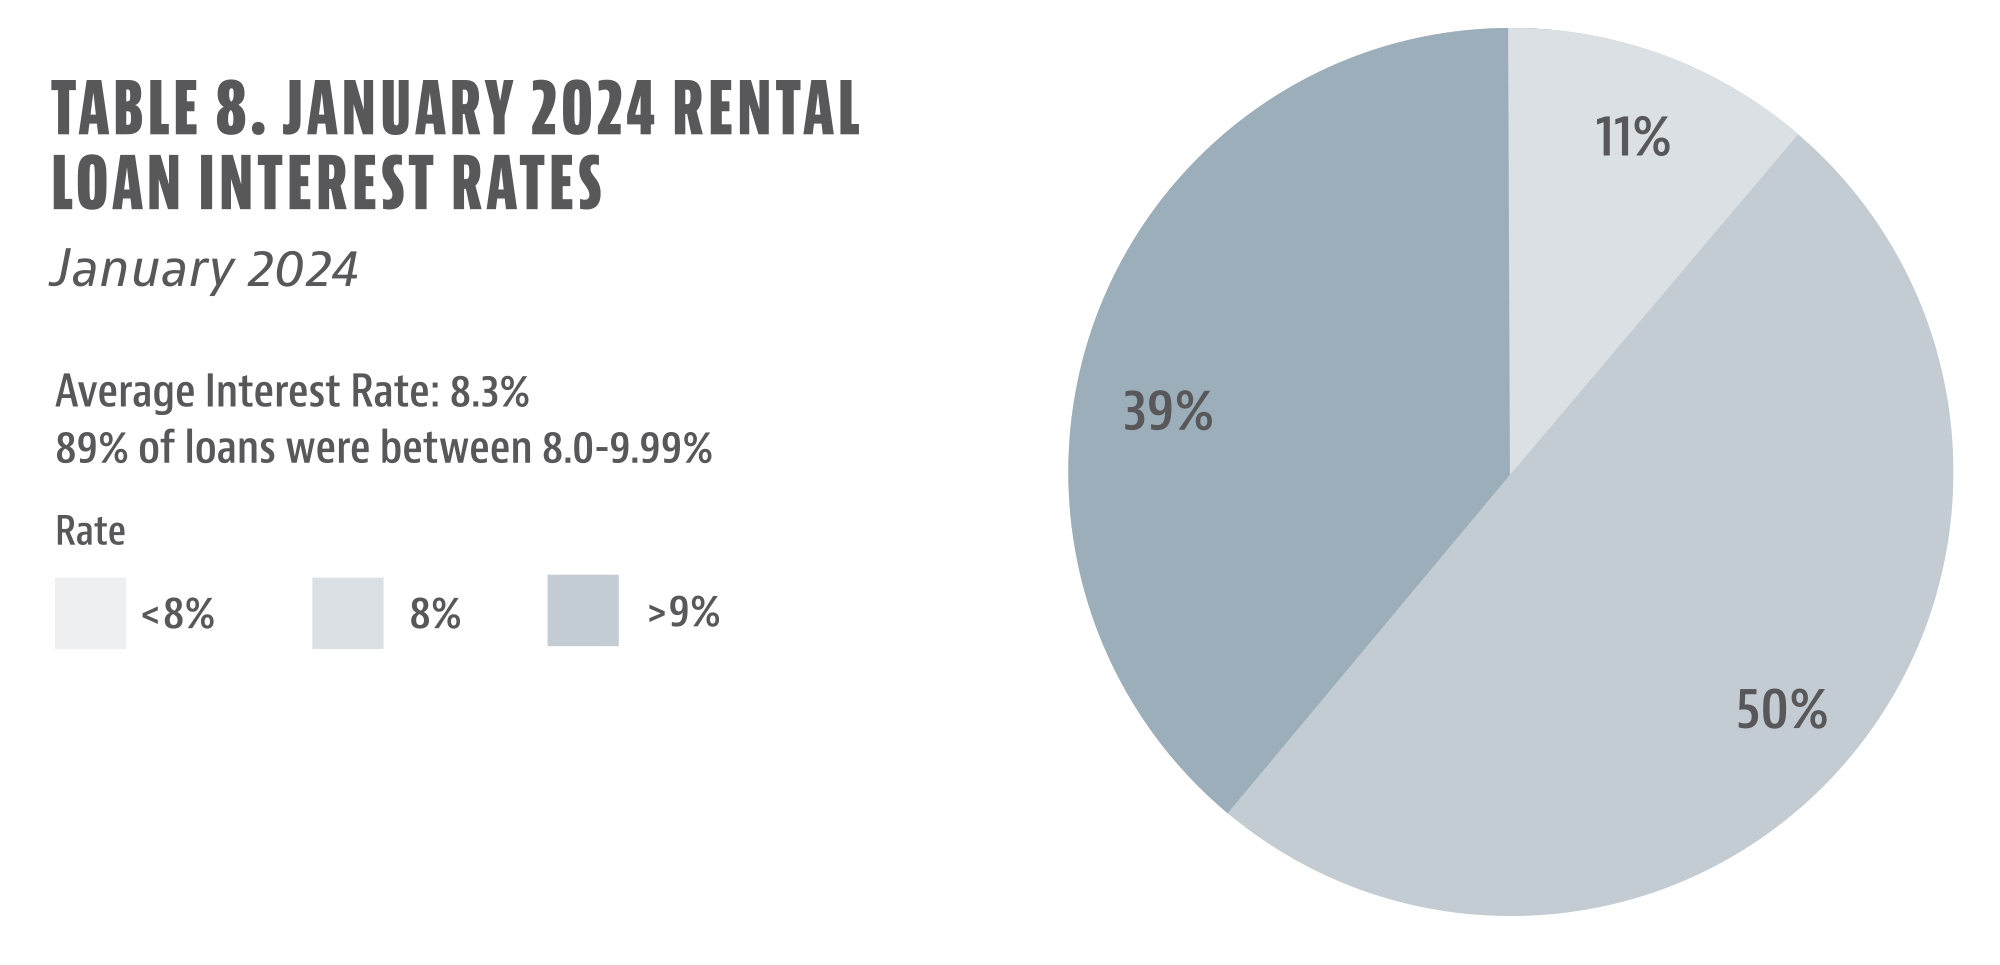
Interest rates were also slightly more homogenous than those for bridge loans, with 50% of loans at the 8. % to 8.99% rate, leaving 39% of them above 9.0 % and just 11% under 8% (see Table 8).
The top 10 rental states by volume saw more movement last year as well (see Table 9). The top two states for 2022, Texas and Florida, each dropped a spot in 2023 as Pennsylvania moved from fourth to first and Ohio from 10th to fifth. California, a state where it is difficult to do rental loans, now no longer registers in the top 10.
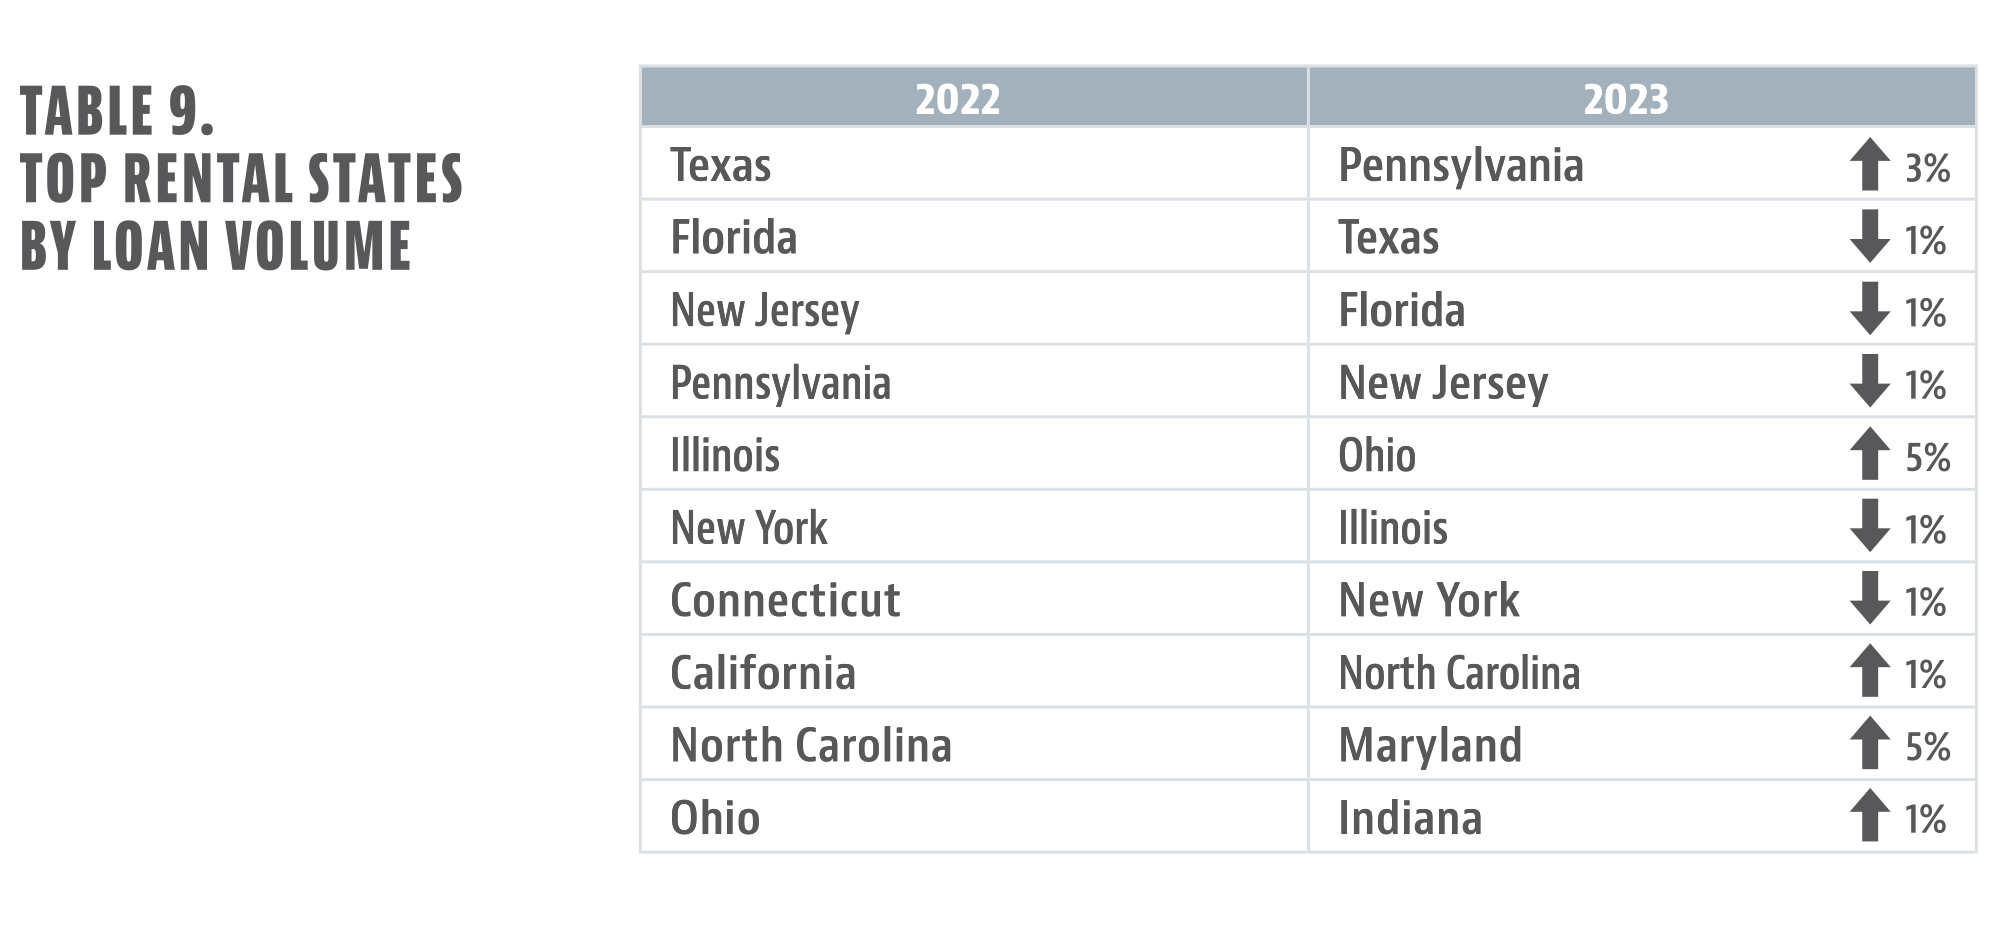
When discussing the migration changes with the largest DSCR originators, it’s a simple math problem. DSCR loans are rated based on the ratio of income produced at the property divided by the loan payment inclusive of property insurance and property taxes. When interest rates were low, many markets penciled well, but as interest rates effectively doubled from 2022 to 2023, the dynamic shifted dramatically toward more affordable real estate markets such as Ohio and Pennsylvania.
The highest-ranked counties (see Table 10) look very different for rental loans than bridge loans, except Cook County, Illinois, which sits on both lists due to the diversity of the housing stock between the city of Chicago and its immediate suburbs.
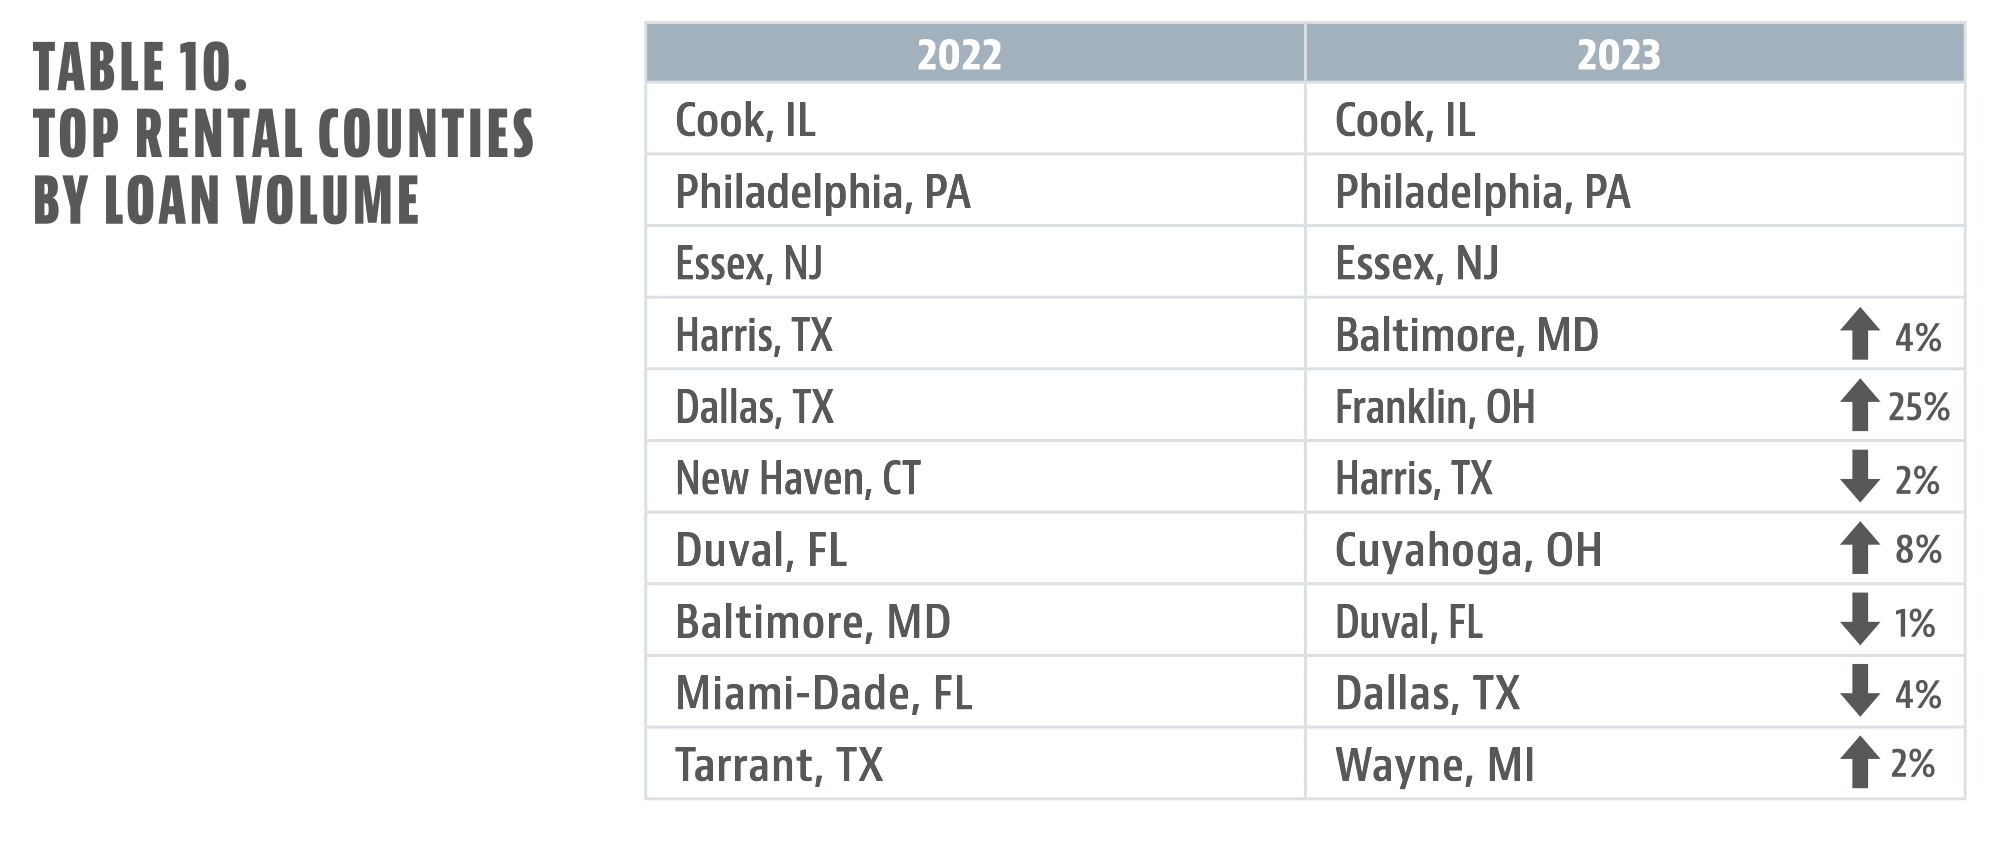
For rental loans, the top three counties held their places between 2022 and 2023: Cook County, Philadelphia, and Essex County, New Jersey. Meanwhile, Harris and Dallas counties sank while the counties of New Haven, Connecticut, and Miami fell below the top-10 threshold.
For more information about Lightning Docs, visit https://lightningdocs.ai/.


Leave A Comment