
Lightning Docs, the official loan document platform of the American Association of Private Lenders (AAPL), recently provided updated data on interest rates and loan volume for both short-term bridge loans and long-term rental loans for the first four months of 2024.
During the last six years, Lightning Docs has collected data for more than 61,000 loans at an aggregate of $33 billion from lenders who have used its platform for loan documents (including 50% of the top 50 private lenders nationally). The updated figures Lightning Docs provided for interest rates and loan volume for short-term bridge loans and long-term rental loans from January to April show the private lending industry is doing significantly better than during this period last year.
Bridge Loan Volume Up
On a year-to-year basis, bridge loan monthly volumes are up from January and April, compared to the same period in 2023, based on a sample size of 125 users on our platform (see Table 1).
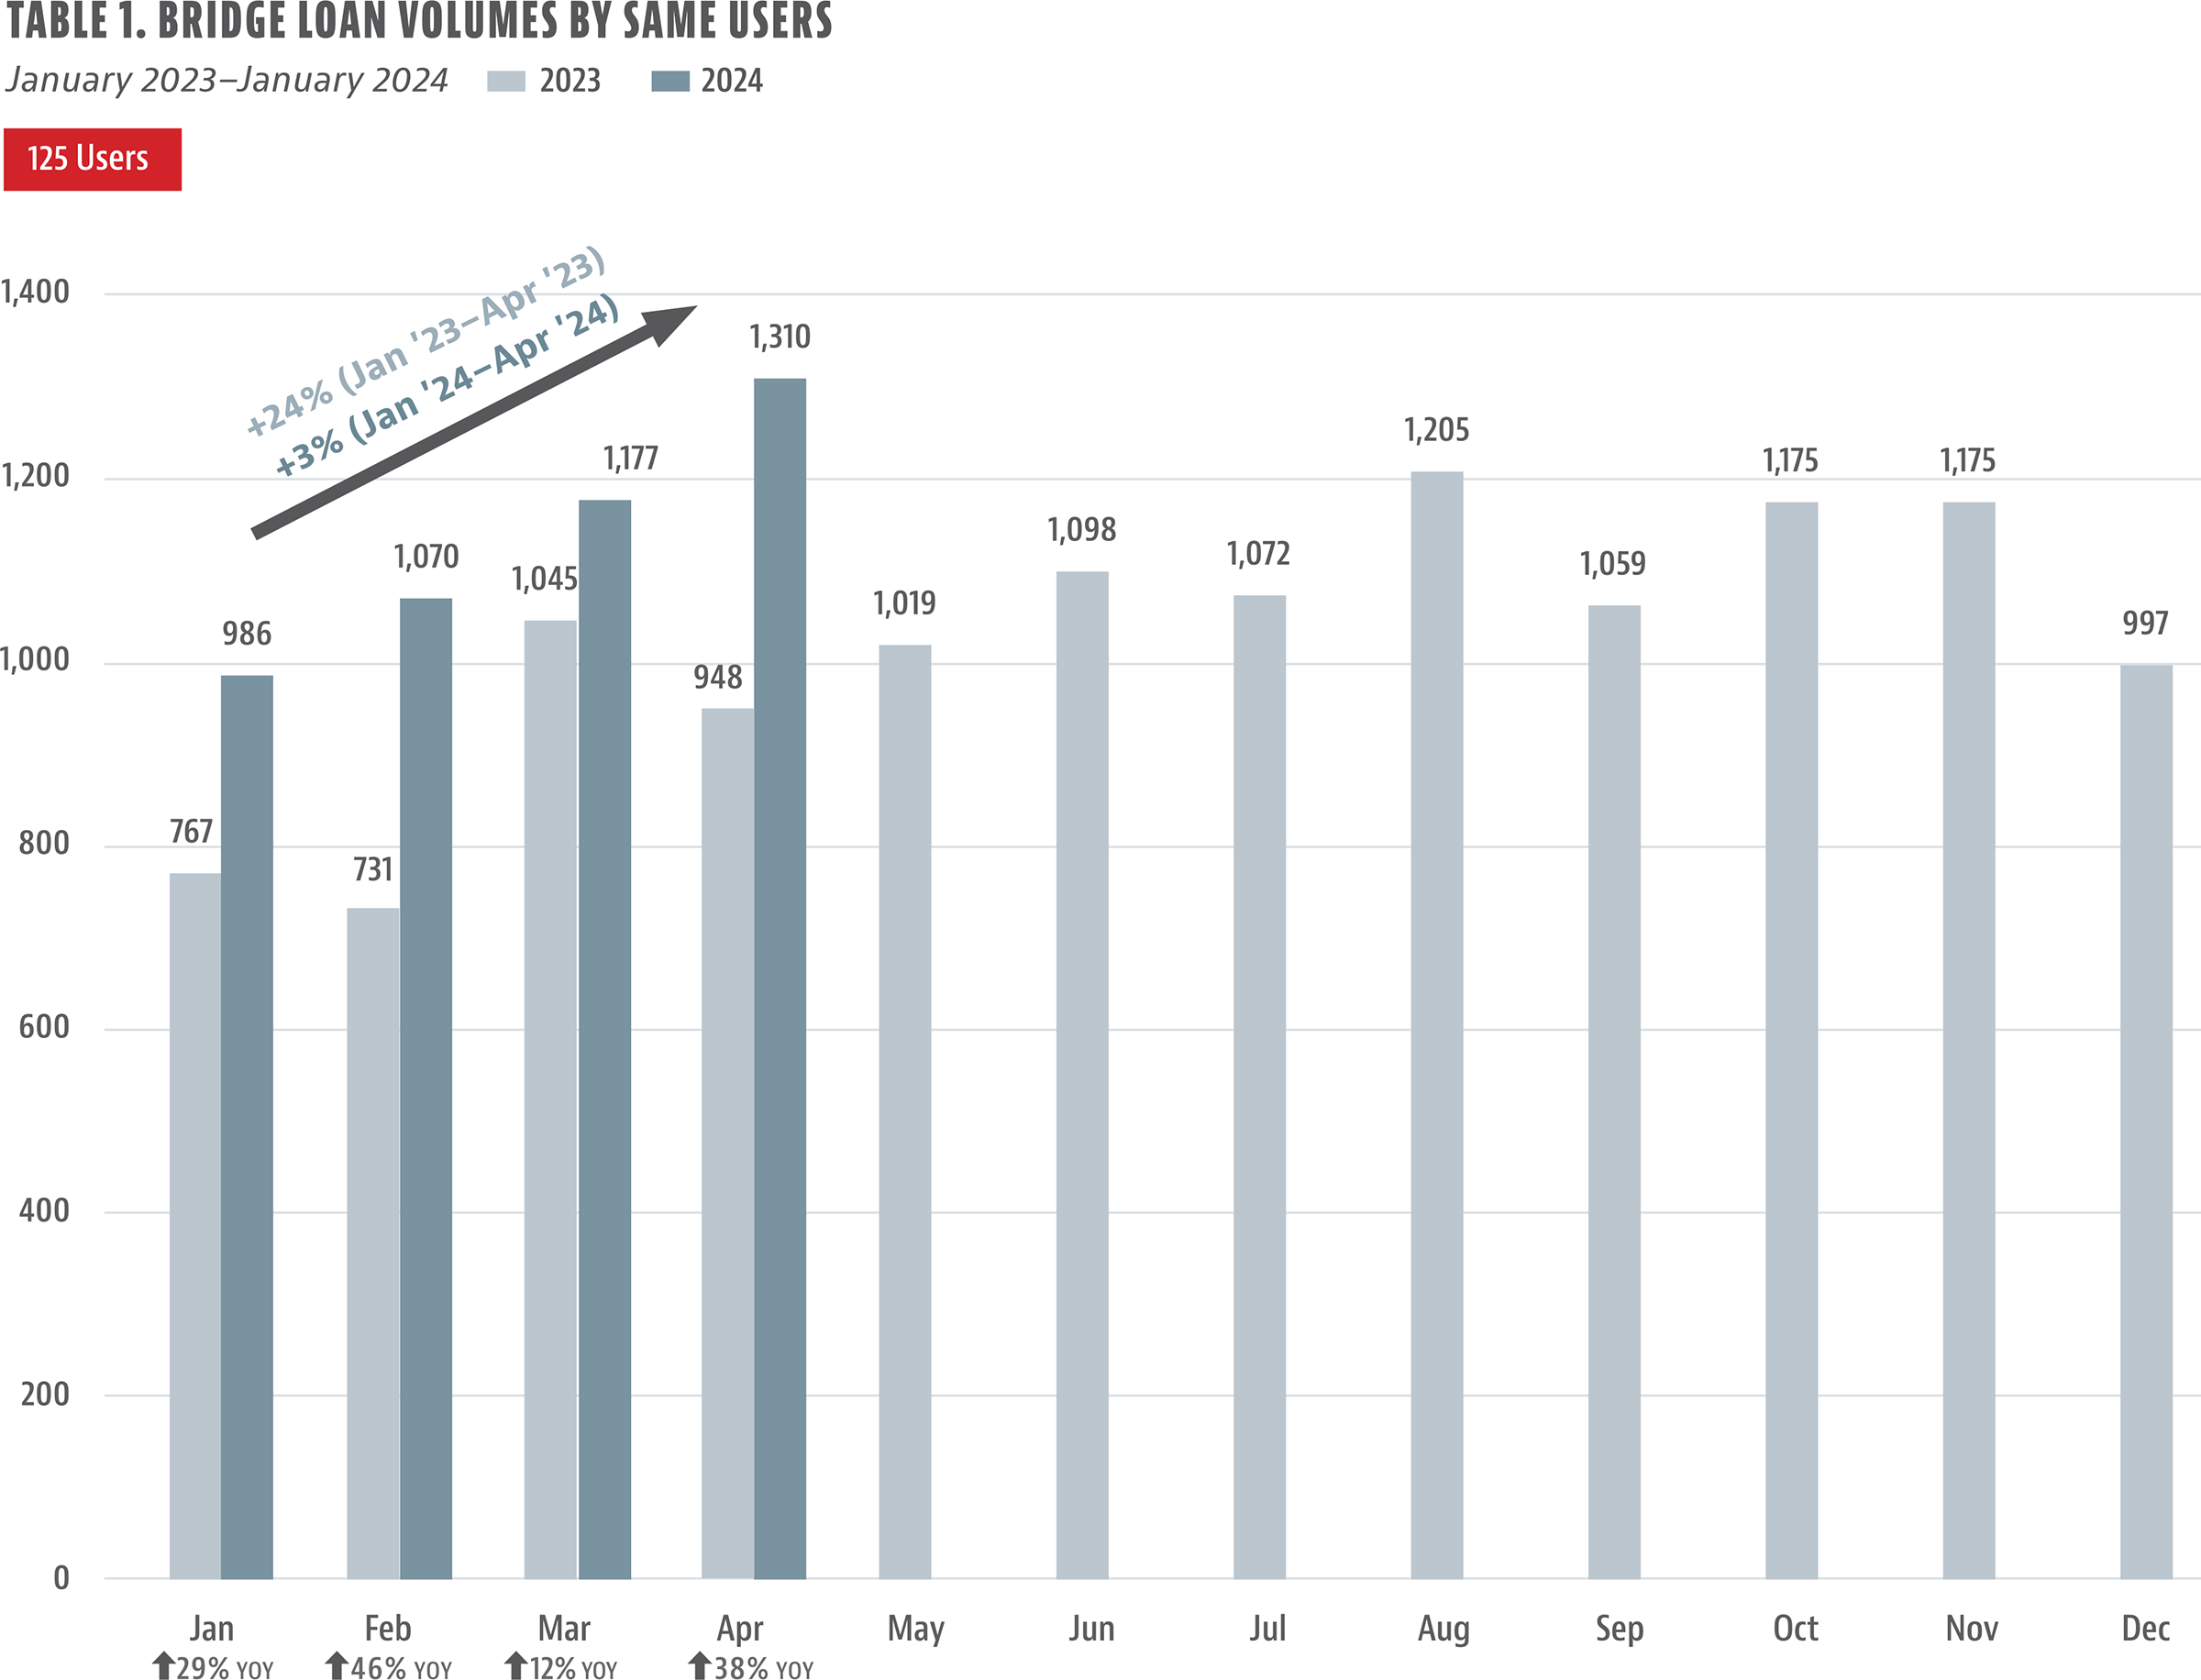
We are defining a “bridge loan” as an interest-only, short-term loan of 36 months or less that can be used for fix-and-flip projects, mild construction to ground up, or as a short-term financing mechanism with no construction (i.e., a true bridge).
The most dramatic year-over-year spike was in February when loan volumes demonstrated a 46% jump up in production from the previous February. Given the poor market conditions at the start of last year, this increase was not entirely surprising. What was surprising was the 38% rise in loan volume comparing April 2023 and April 2024. By April last year, loan volumes had mostly stabilized across Lightning Docs users. Should these trends continue, this is great news for the private lending industry.
Bridge Loan Interest Rates Hold
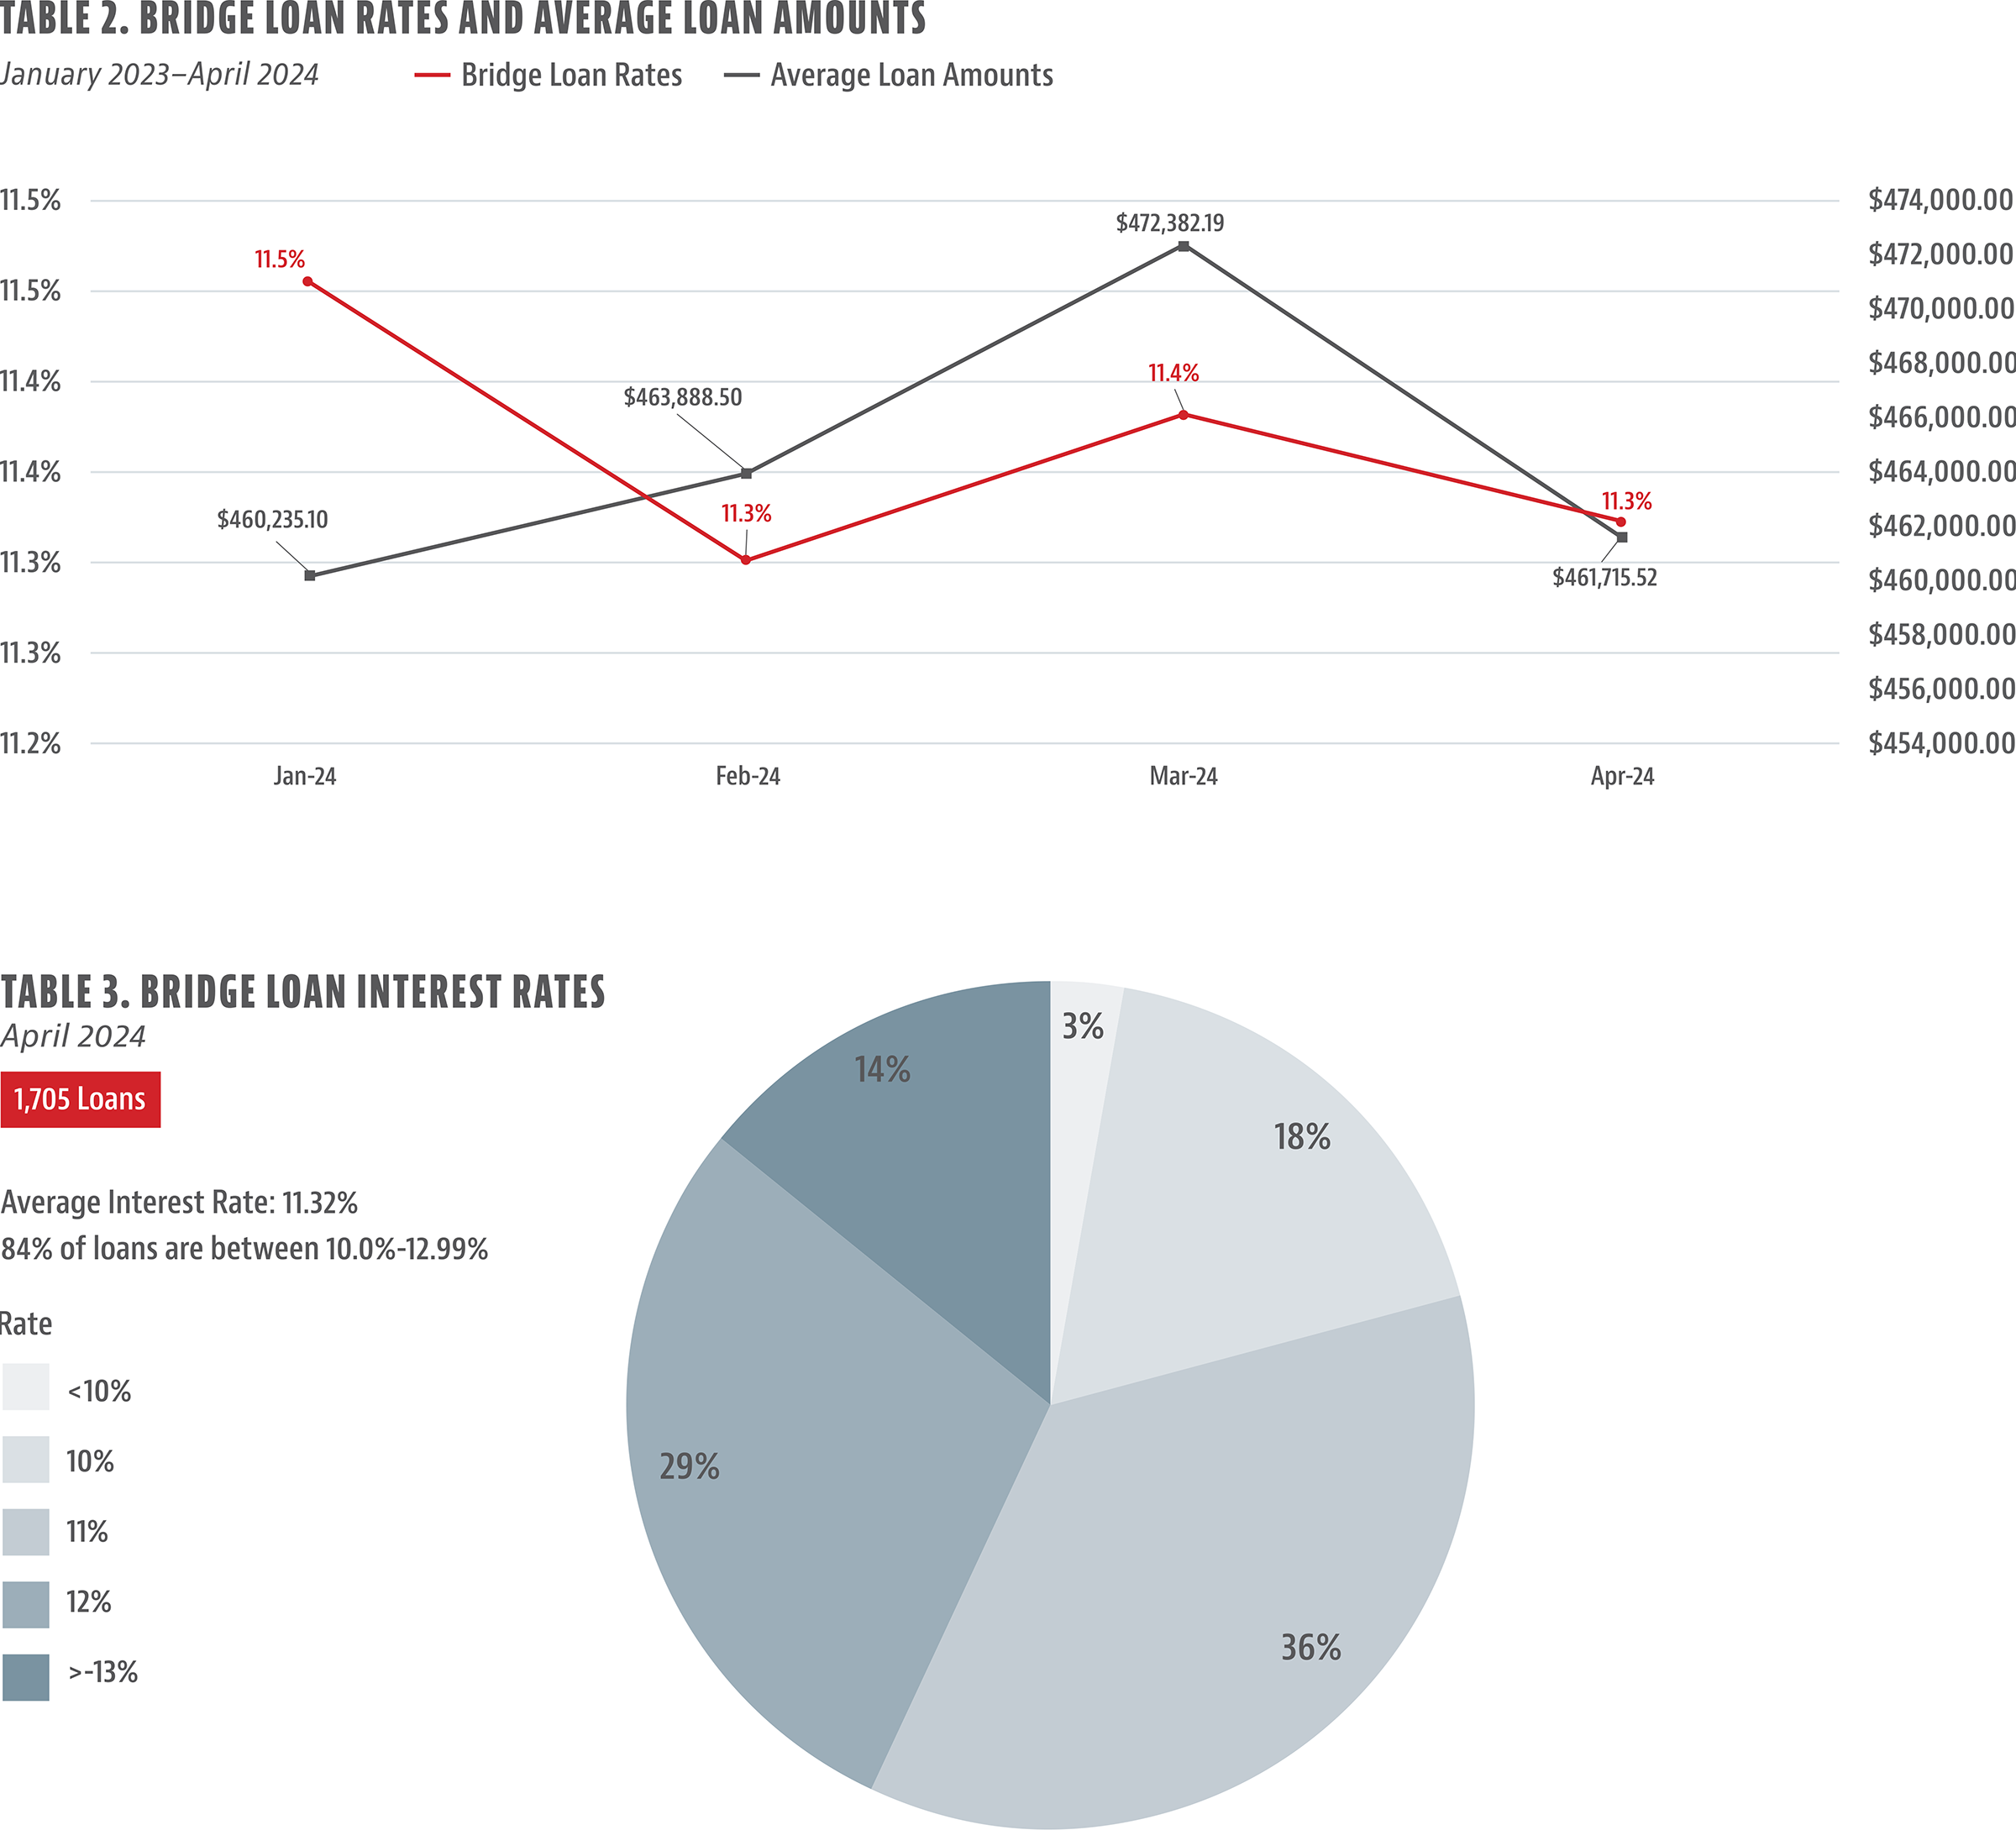
Interest rates for short-term loans nationally continue to hover around an average of a little over 11%, peaking at 11.5% in January and dipping to a low of 11.3% in February and April (see Table 2). The average loan amount has remained close to $460,000 for most of the past four months, except March, when it climbed to $472,382. To exclude outliers, we limited our analysis to loans between $50,000 and $2 million.
When segmented by individual interest rates, in April 2024, 84% of loans fell within the 10%-12.99% range, based on a data set of 1,705 loans. There are exceptions at both ends of the spectrum: 3% of loans came in under interest rates of 10% while 14% of them topped 13% (see Table 3).
Bridge Loan Activity by State and County
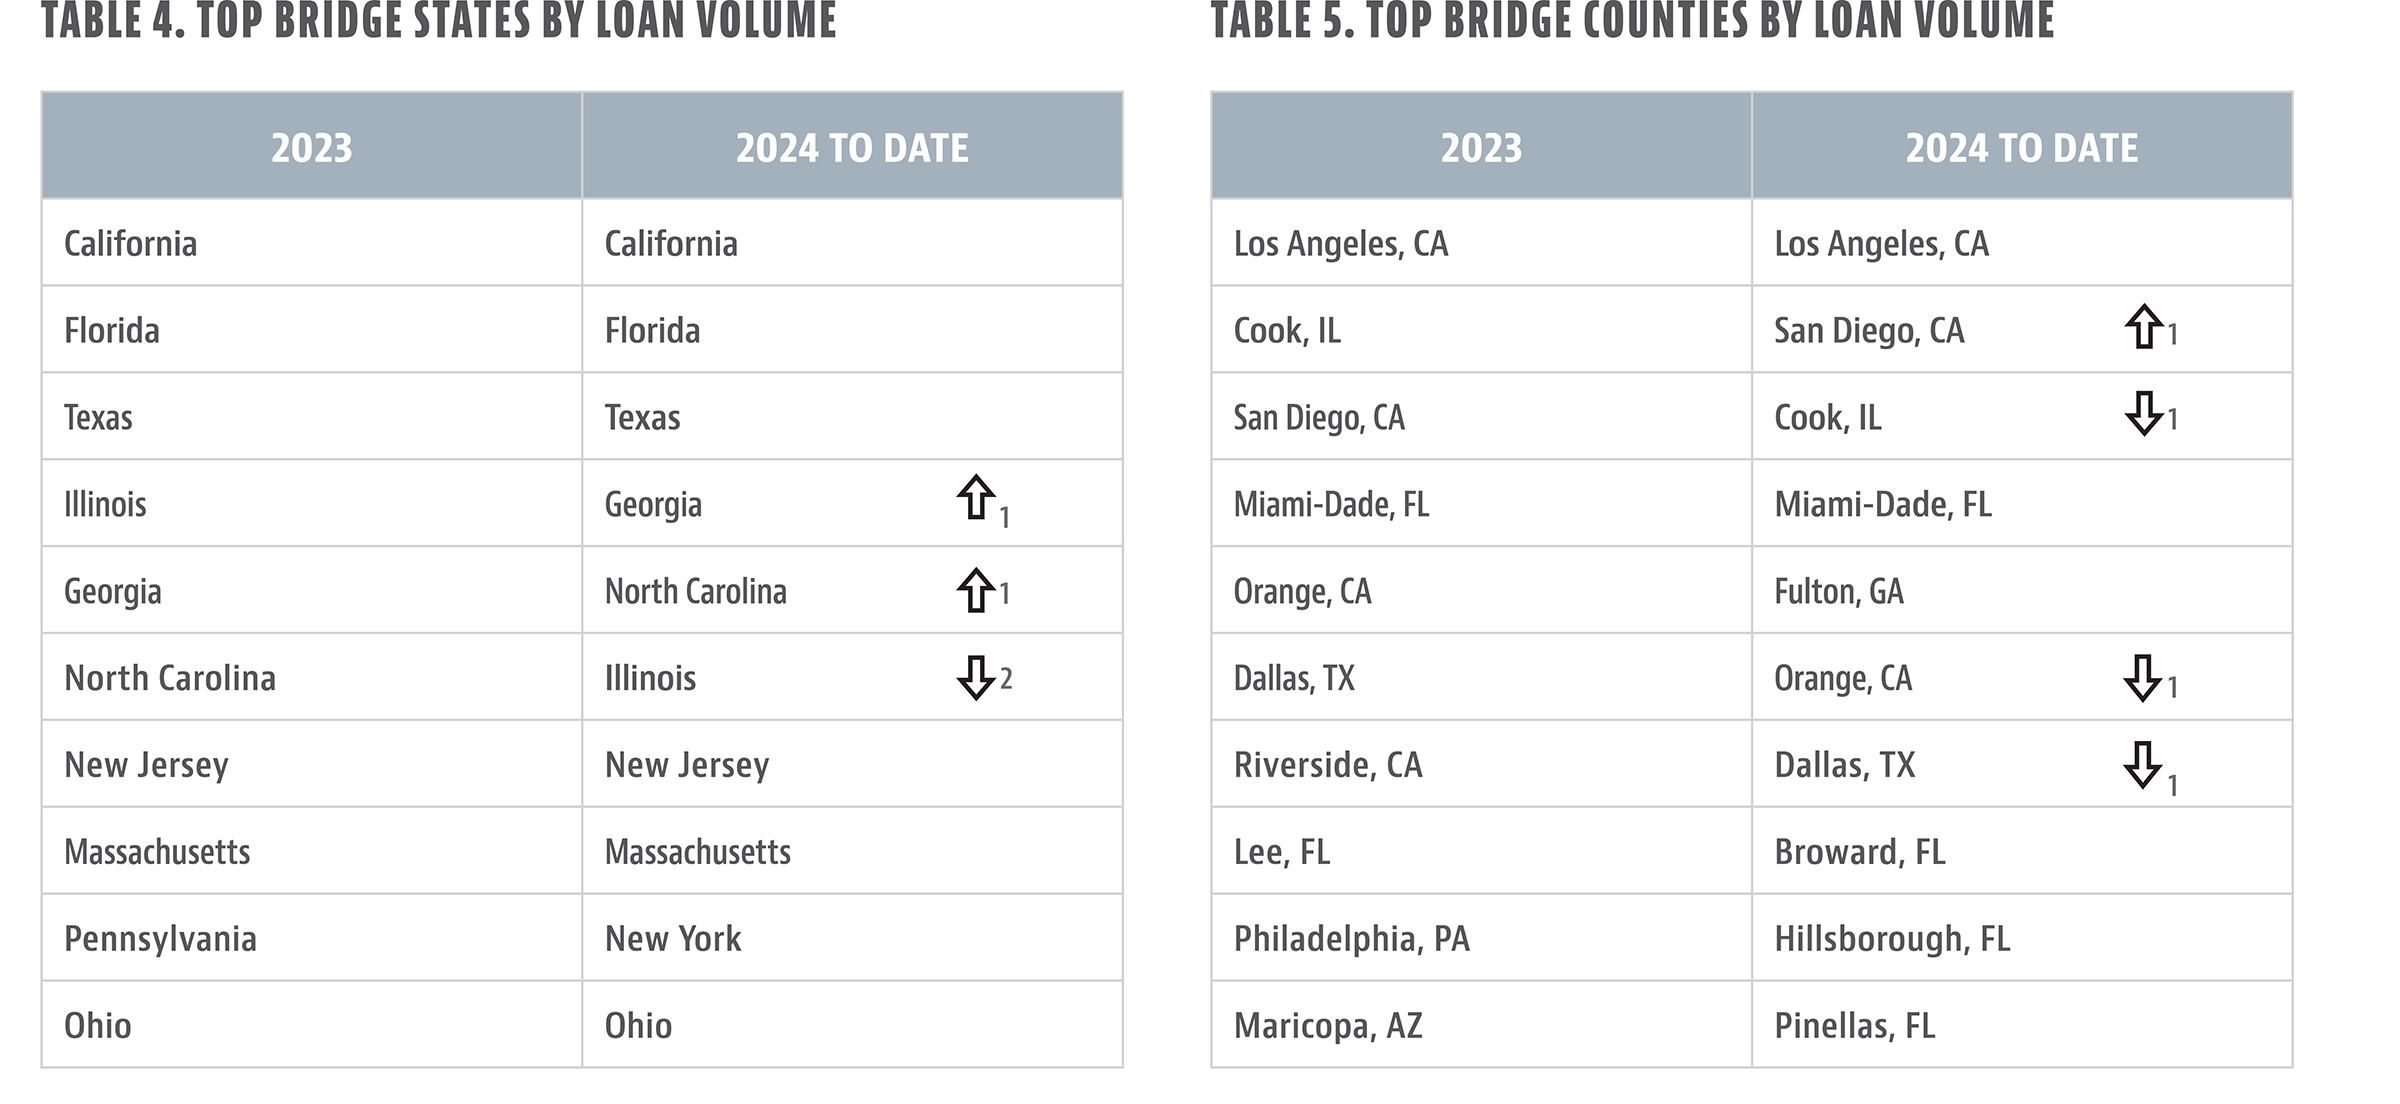
In terms of activity, California, Florida, and Texas remained the top three states, in that order, between 2023 and 2024 so far. Illinois, Georgia, and North Carolina shifted slightly within the middle of the top 10, while New Jersey, Massachusetts, and Ohio held on to their places in the bottom half of the list. (Pennsylvania dropped out of the top 10, while New York took its place as the ninth most active state.)
At the county level, Los Angeles is still the No. 1 county in terms of overall activity, and San Diego inched up to second place and Cook County moved down to third. Dallas and Orange County each dropped one place from fifth and sixth place, respectively, in 2023 (see Table 5). Overall, three of the most active counties were in California; four were in Florida.
Gauging Interest Rate Volatility by County and Month
Lenders who provide bridge loans need to be aware of the market environment to correctly price loans and avoid leaving money on the table or being overpriced. With that need in mind, our industry report, for the first time, includes a look at the volatility of interest rates by month for the most active counties (see Table 6). Los Angeles holds to a fairly consistent interest rate, starting with 11.52% in January and coming out to 11.29% in April. Three of the top 10 most active counties, however, showed some wild swings in rates. Orange County went from 12.17% in January to 10.74% in April—a difference of almost 1.5%. Orange County stands out for a highly unusual confluence of both high loan amounts and high interest rates.
Another high-volatility market is Miami-Dade, which moved 79 basis points between February and March this year. A further dramatic change was found in Pinellas County, Florida, where the rate plummeted by nearly 80 basis points, from 11.75% in January to 10.97% in April. The remaining active counties showed much less rate volatility.
Rental Loans Performing Better
Rental loans have also performed better in the first four months of 2024 than the same period last year, when they faced a fairly shocking interest-rate environment (see Table 7).
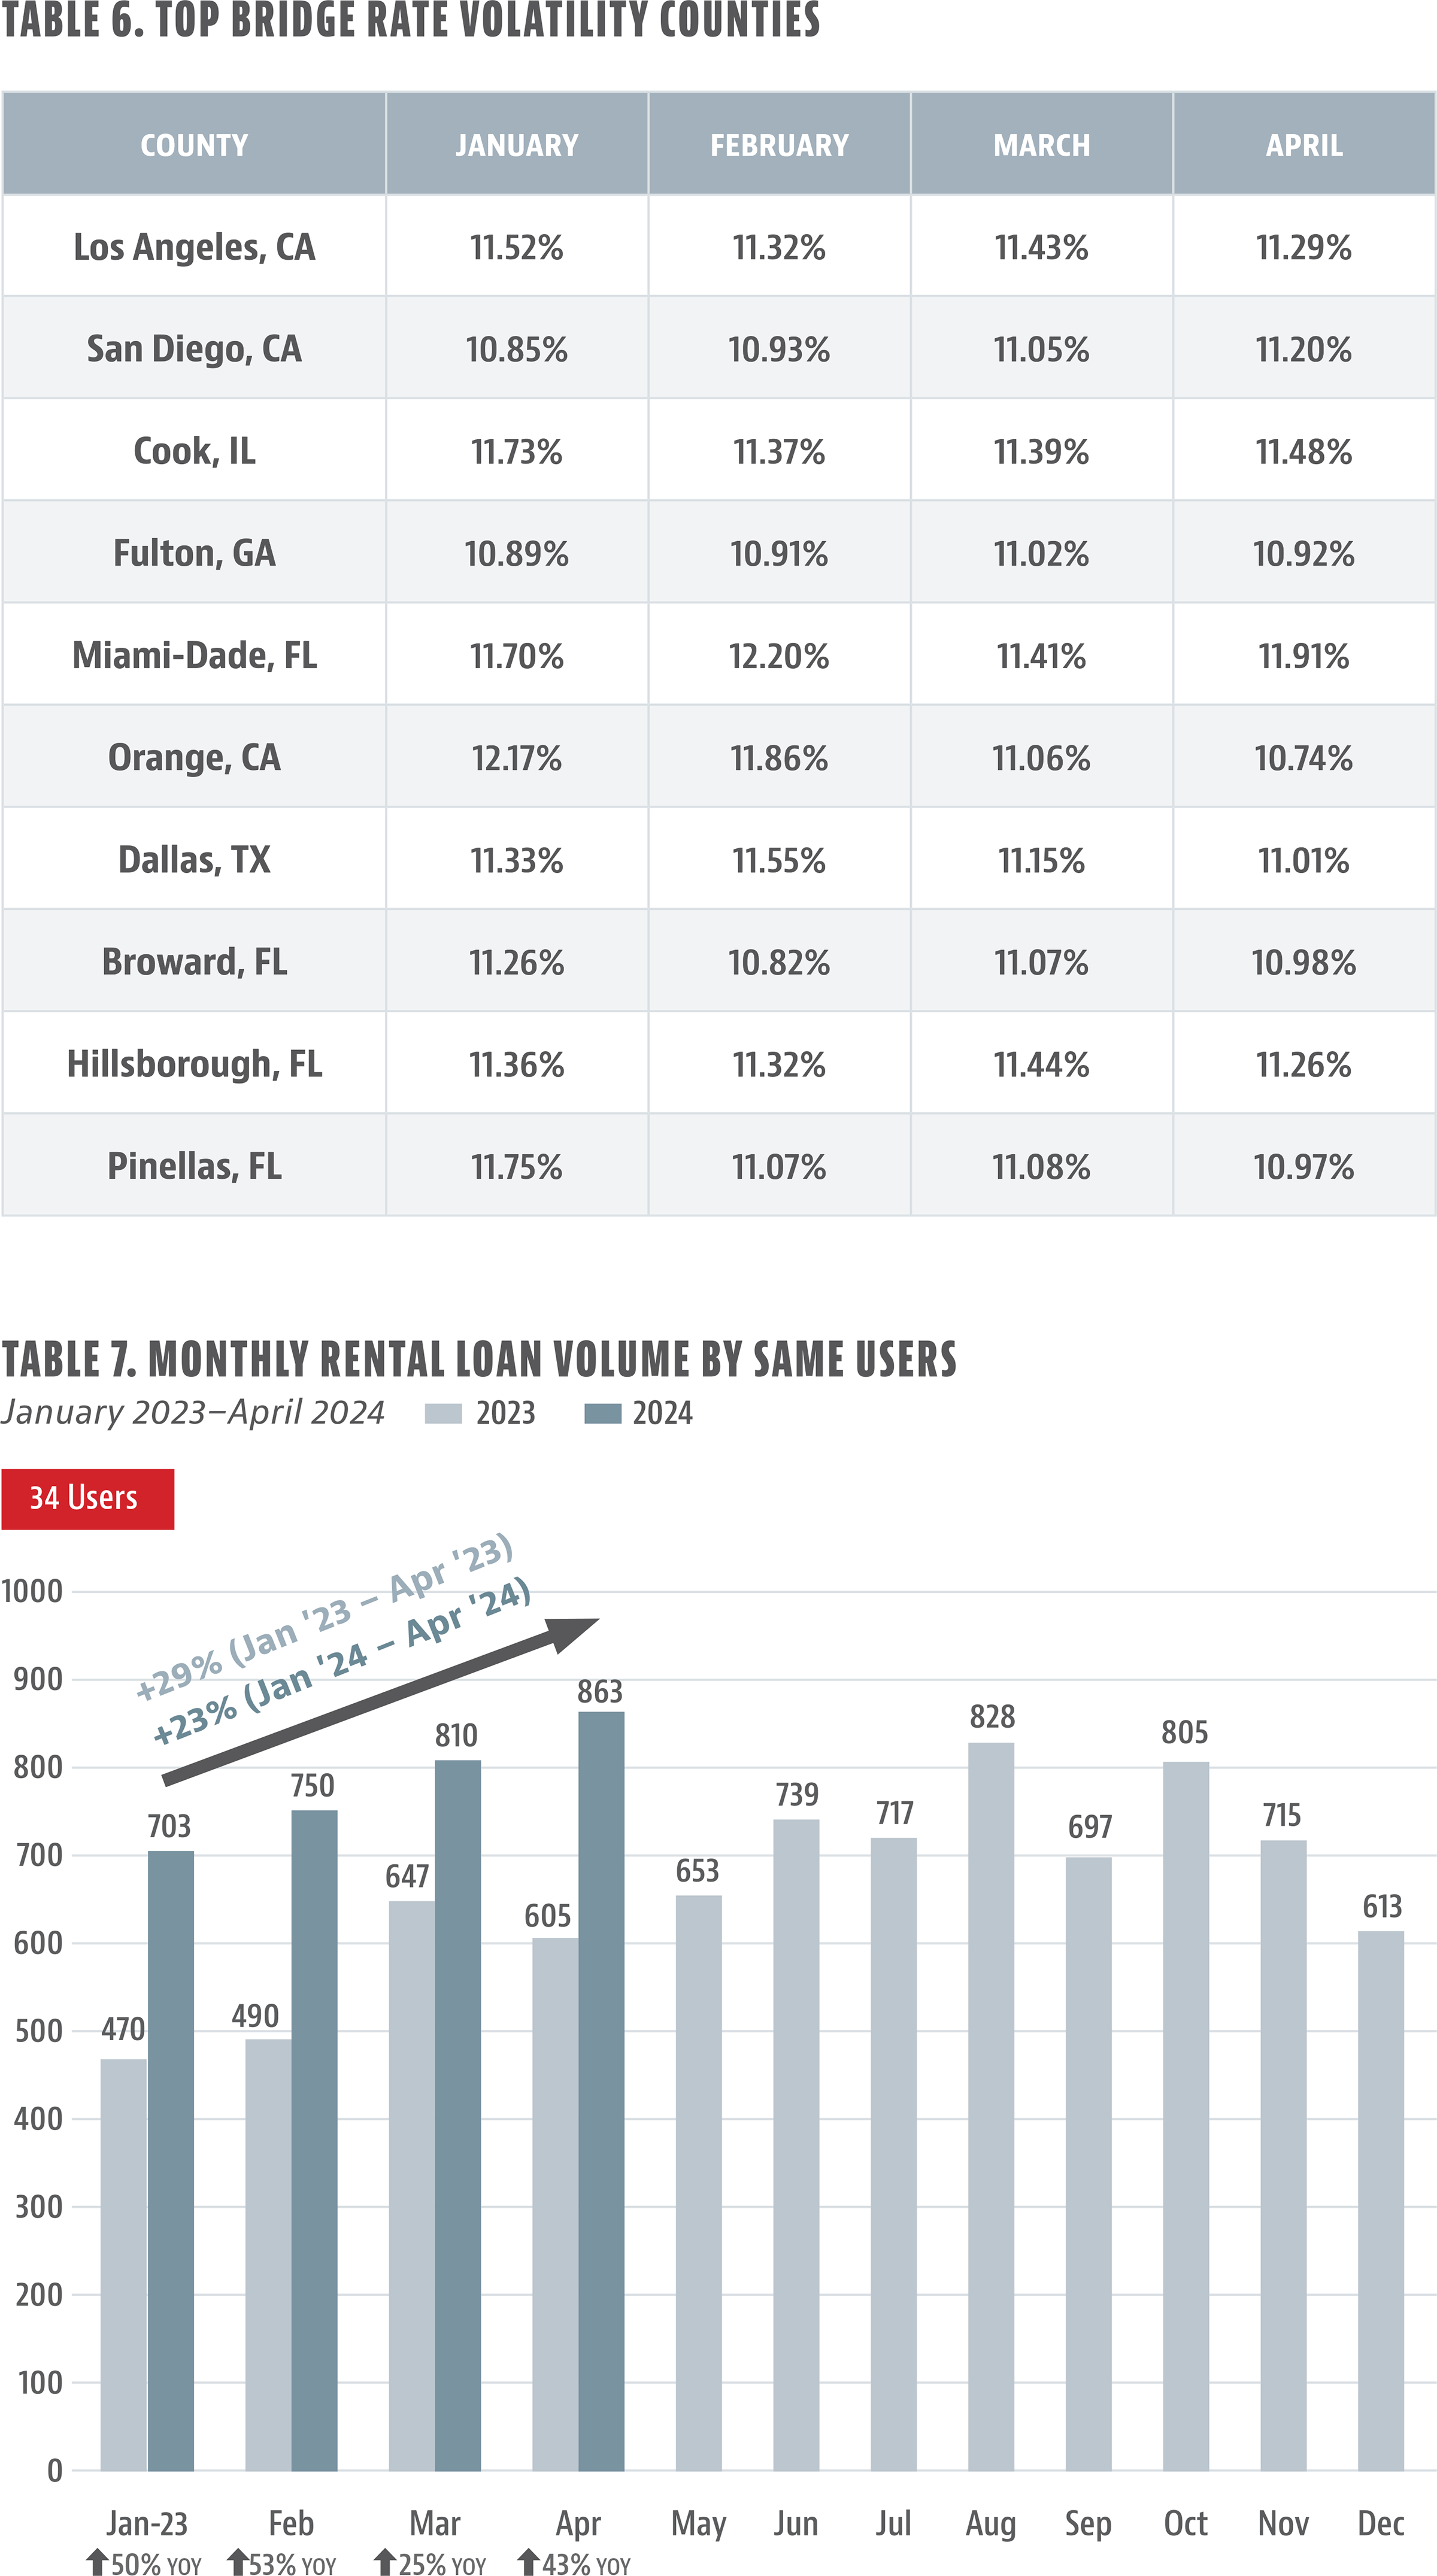
For our purposes, ”rental loans” are defined 30-year loans secured by rental property. They are also known as Debt Service Coverage Ratio, or DSCR loans. Loan volumes showed the greatest year-to-year improvements in January and February, reaching 50% percent or more than each of those months in 2023 (based on a sample size of 34 users). Similar to bridge loans, Lightning Docs users experienced significant unexpected growth comparing April 2023 to April 2024, with 43% growth year over year.
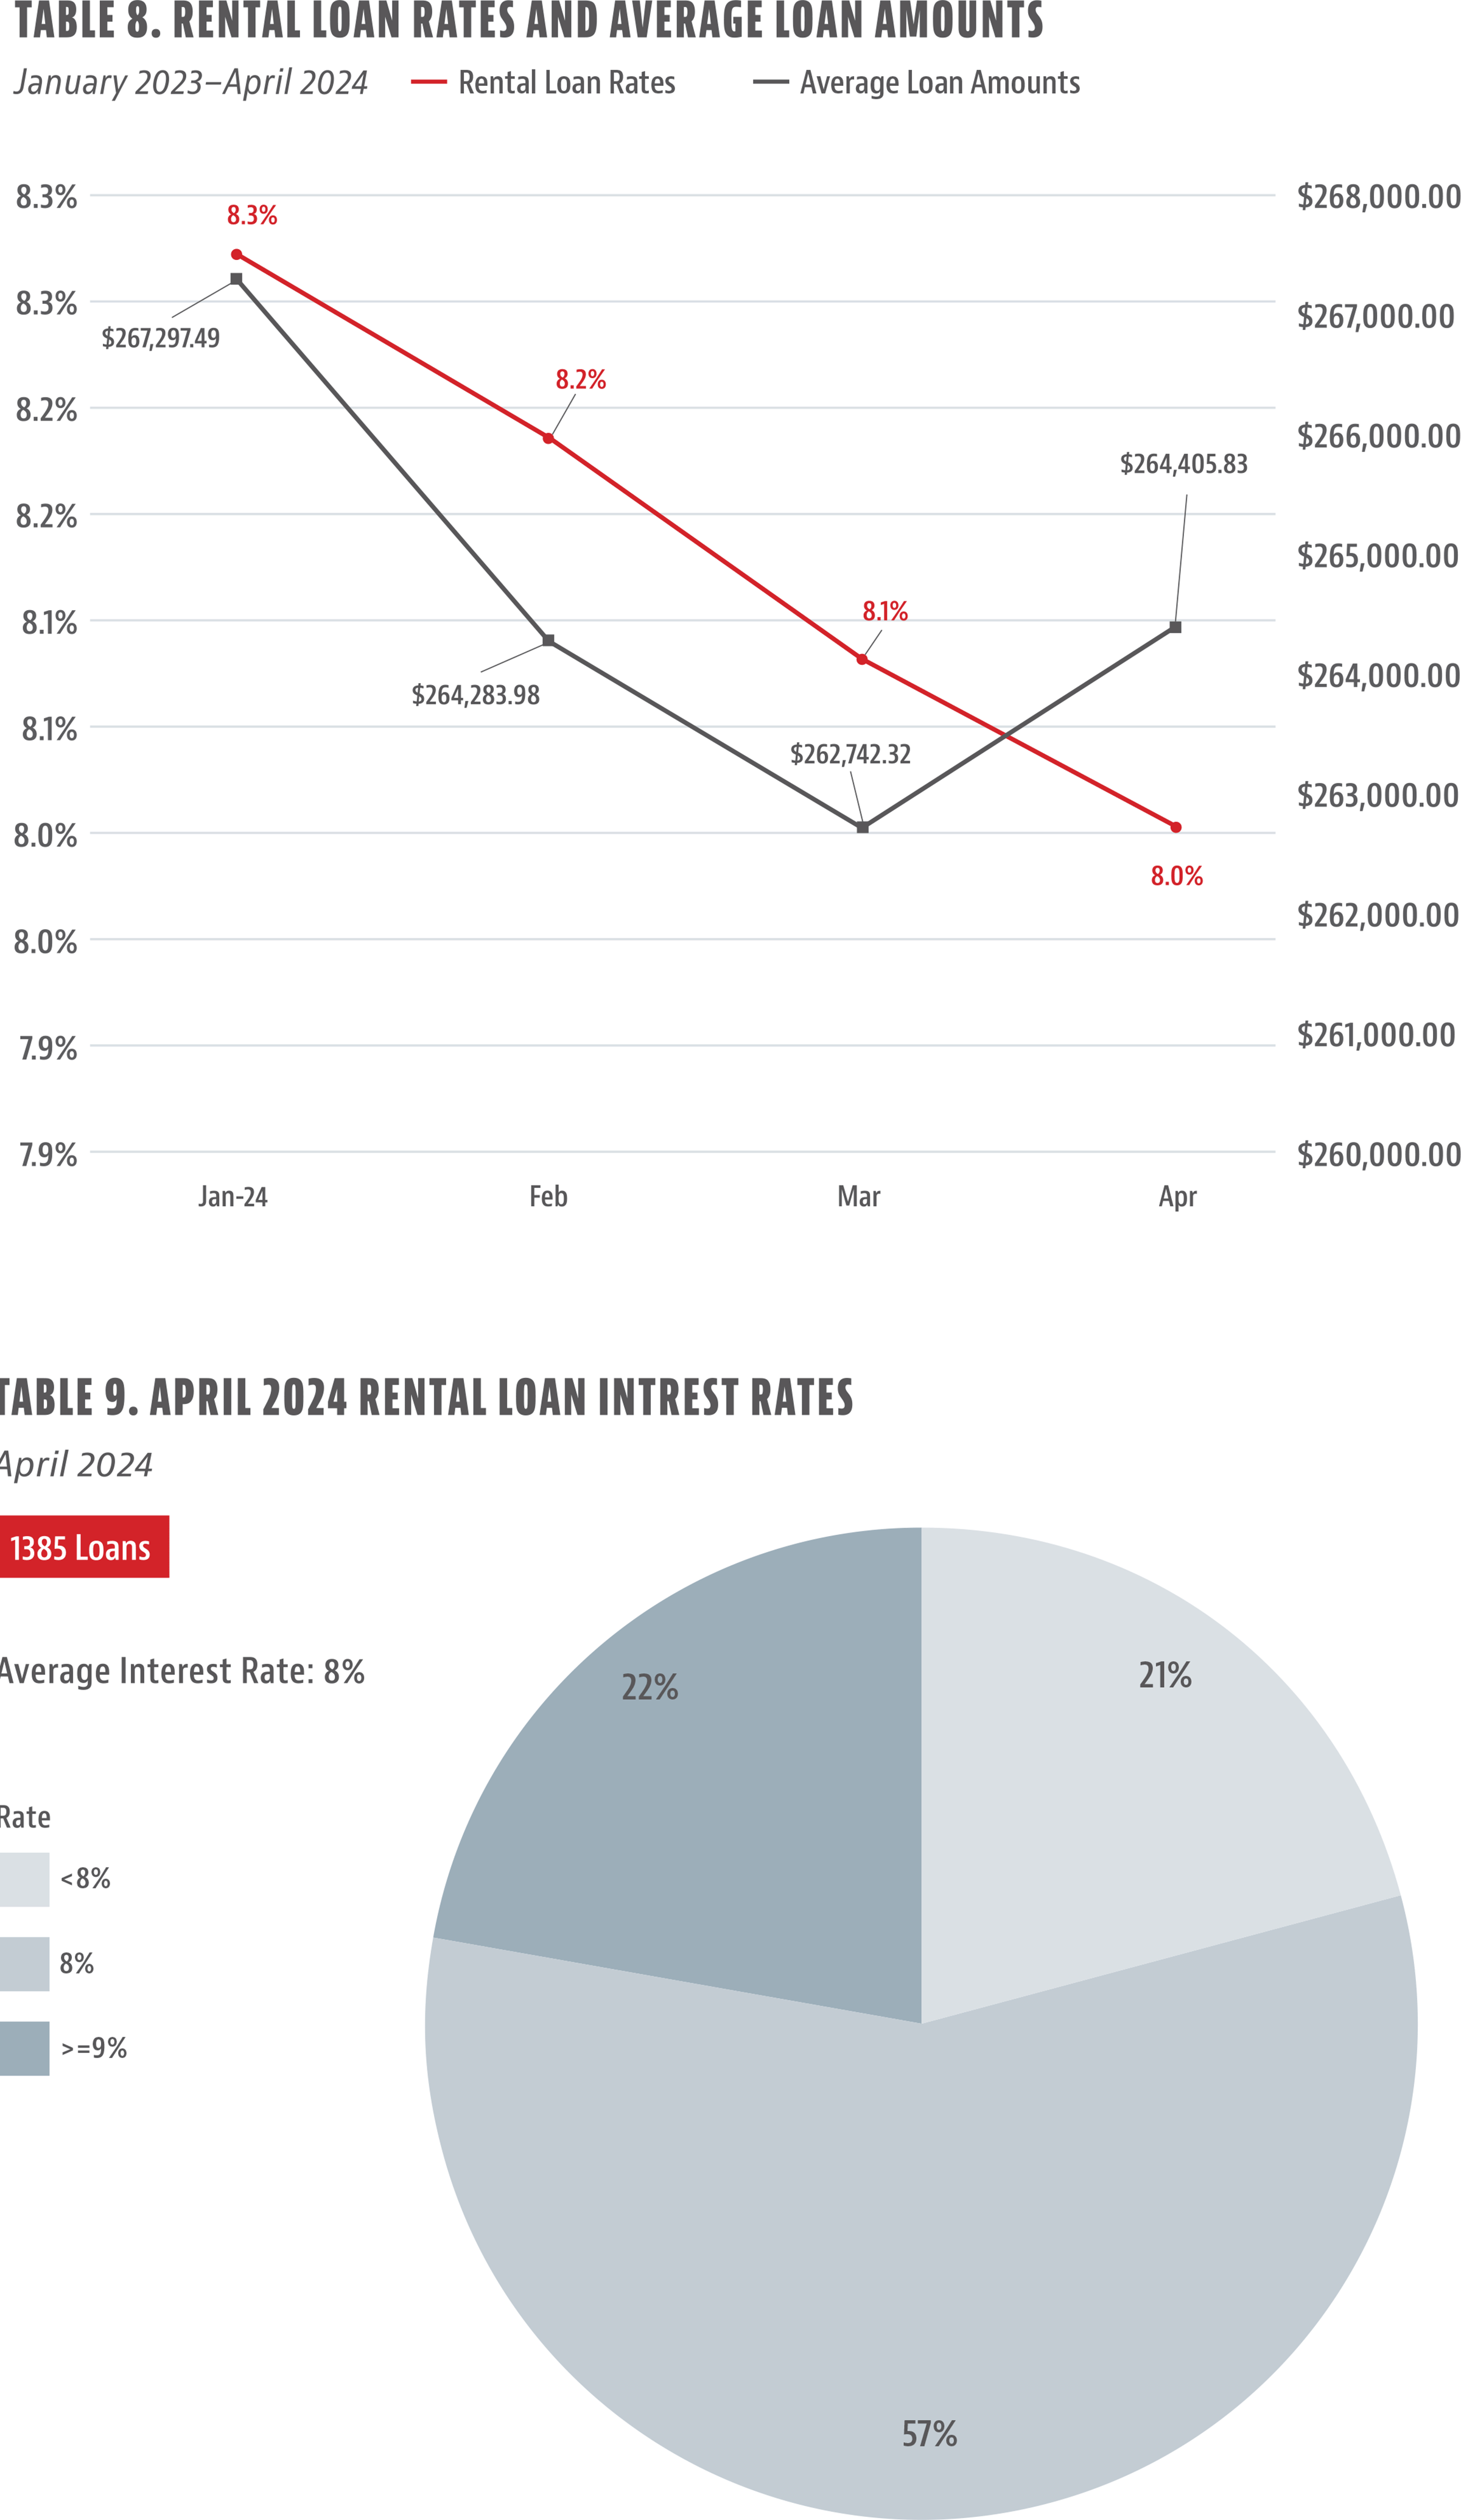
Rental Loan Interest Rates Remain Around 8%
Rental loan interest rates started at 8.3% in January and steadily decreased from there to a flat 8% in April (see Table 8). Average loan amounts have been sticky—at $264,000 or close to it. Unlike bridge loans, rental loans tend to follow the same flow as other major related indices, such as the 10-year Treasury yield and the consumer mortgage interest rate. All three of those metrics—for rental loans, consumer mortgages, and Treasury bonds—reached a peak in October or November of last year and have generally tapered off since then. The interest rate for bridge loans, on the other hand, does not seem to be mirroring the pattern of any of the underlying indexes, staying relatively flat—at or around 11% over the 14 months from January 2023 to April 2024. However, that stability could change as rated securitizations for private loans bring more liquidity into the market.
Looking at April 2024, when segmented out by interest rates, rental loans have less rate diversity compared to bridge loans (see Table 9). Most are at the 8% rate, with 21% of the loans less than that and slightly more above 9% (using a sample size of 1,385 loans).
Pennsylvania Dominates in DSCR Loan Activity
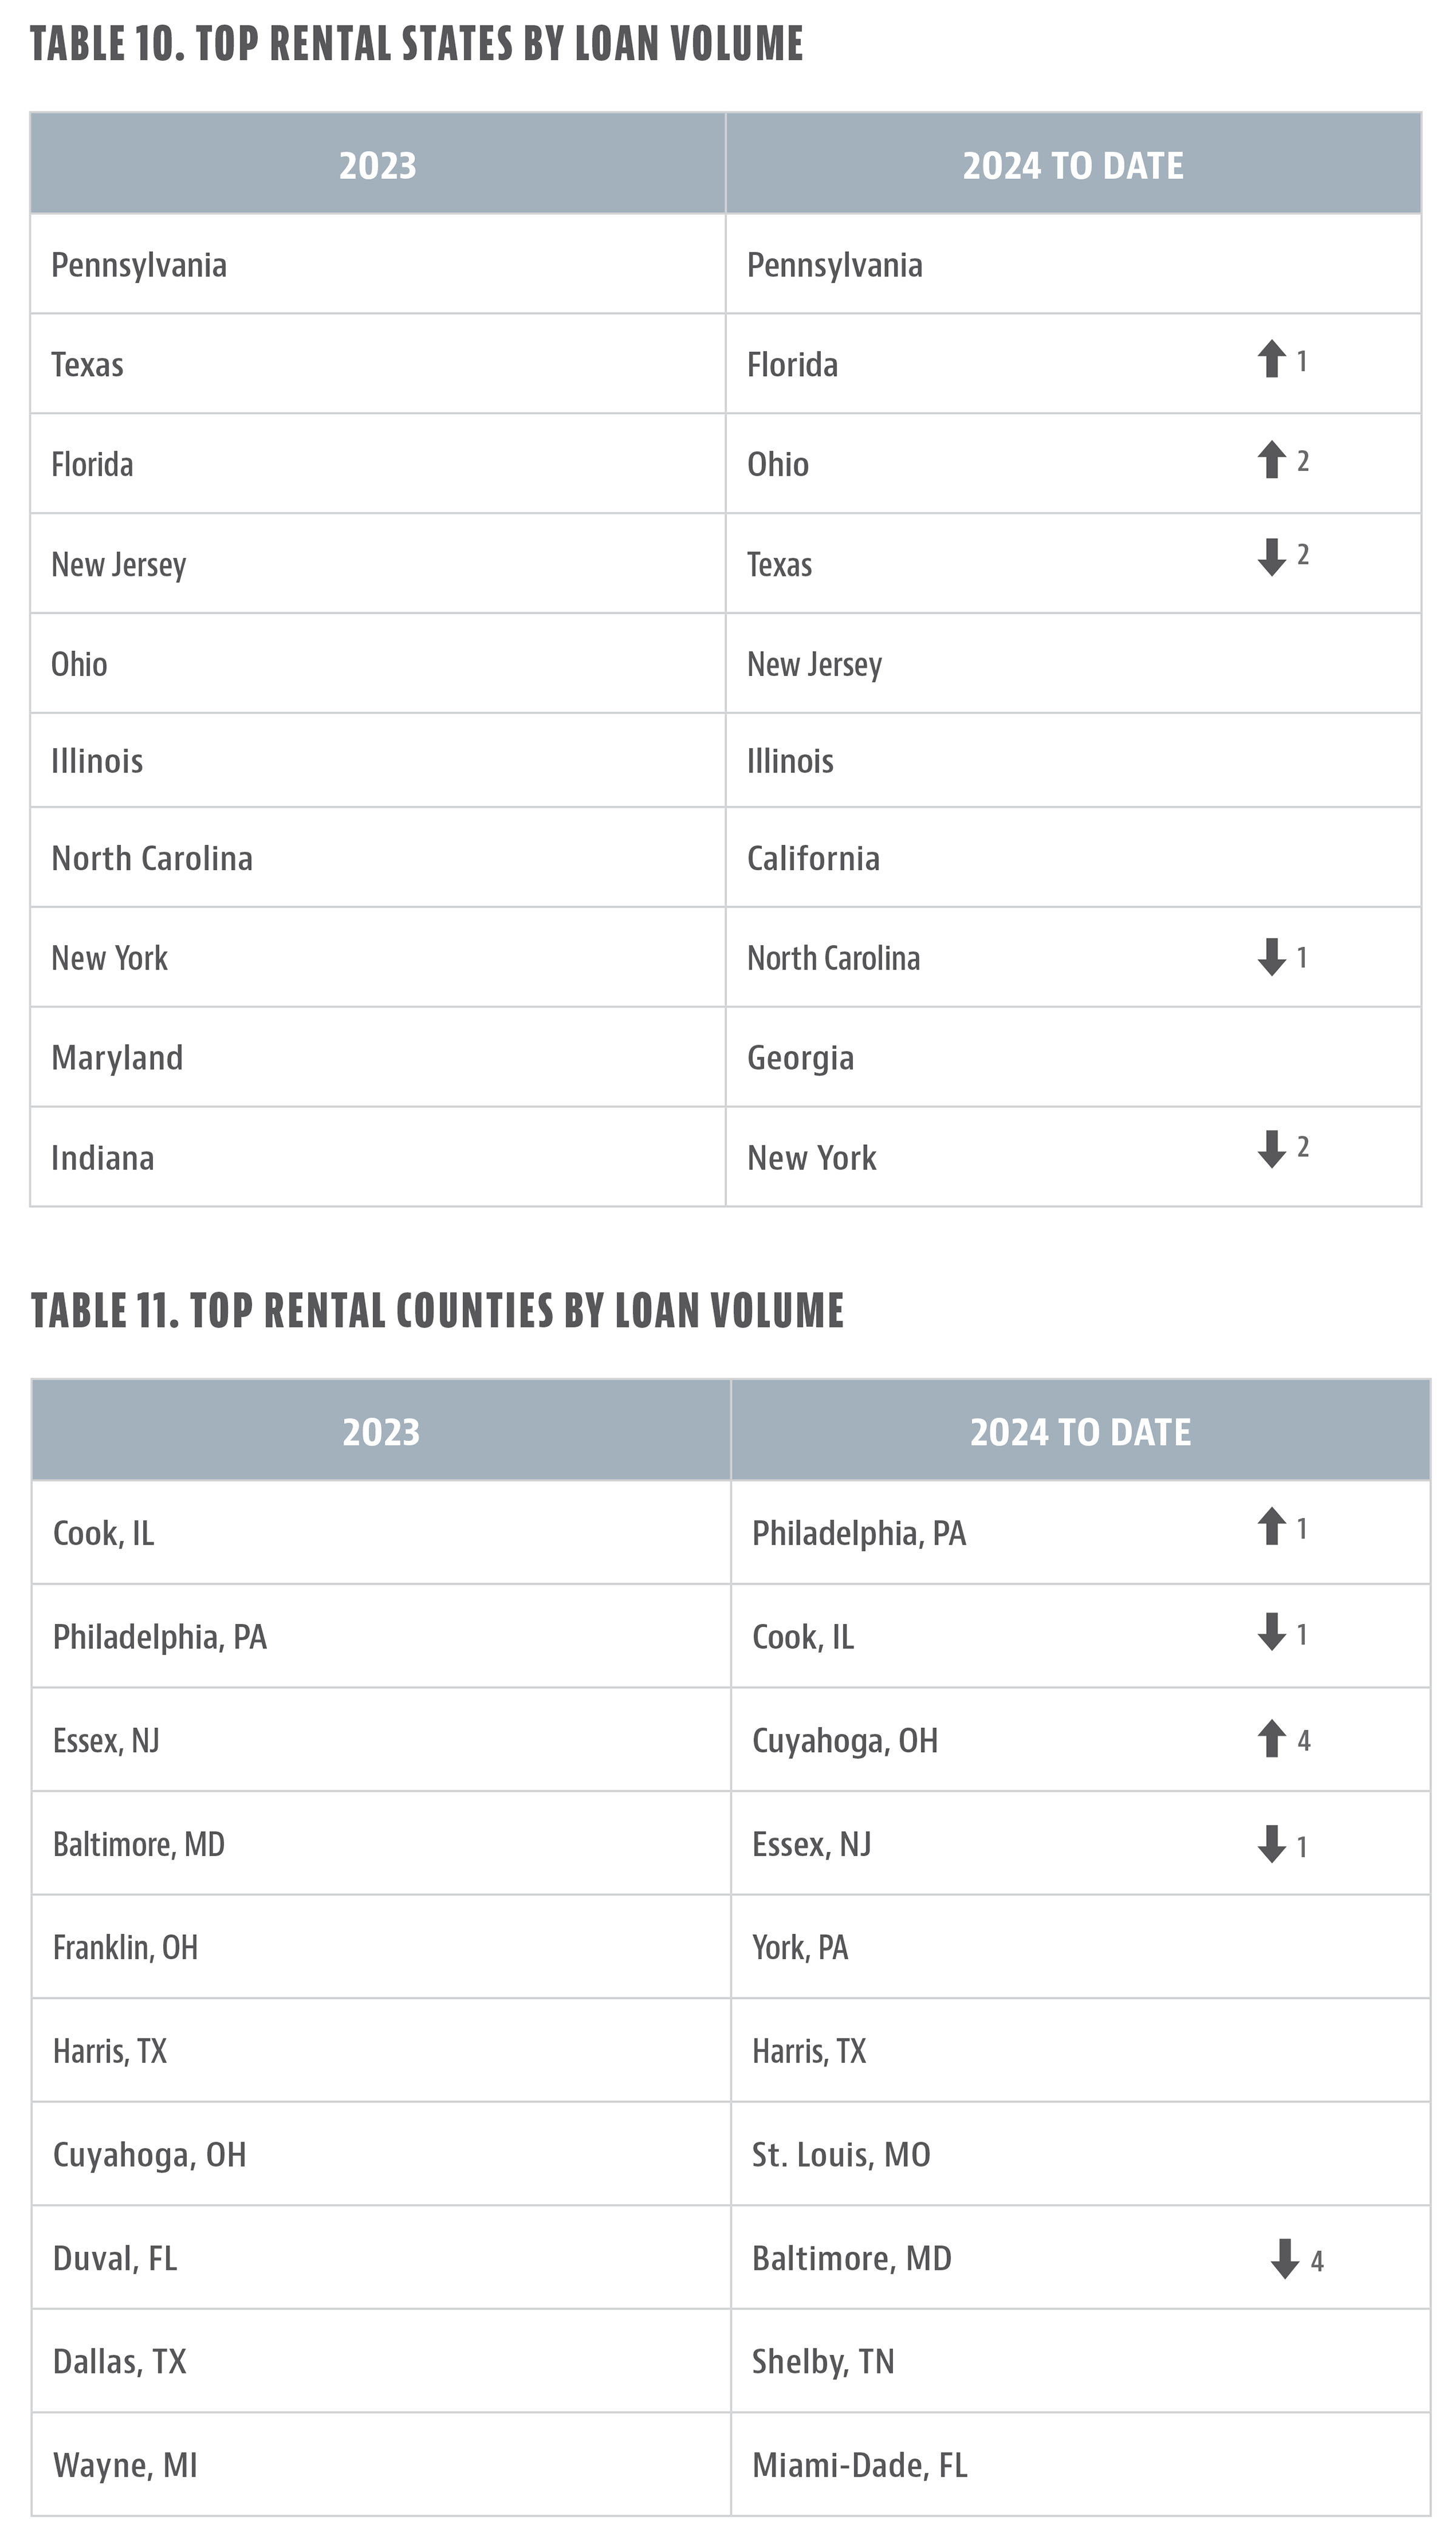
From January to April of this year, Pennsylvania has kept its spot as the No. 1 state for rental loan activity. Florida and Ohio are top contenders, both as second and third overall. Although many states have shifted places, most of the top 10 states are the same. What has been interesting is to see California jump back into the top 10 (see Table 10).
The top 10 most active counties reflect Pennsylvania’s dominance, with Philadelphia as the top market, switching places with Cook County (see Table 11). No California county made the list, while Florida and Ohio are still major players (with Cuyahoga in Ohio and Miami-Dade making the cut). Harris County also registers as a Top 10 county for both bridge and rental loan activity.
For more information about Lightning Docs, visit https://lightningdocs.ai/.


Leave A Comment