
One year after overtaking bridge, DSCR lending continues to pull ahead.
Lightning Docs is a fully automated, cloud-based loan document solution developed by the partners of Fortra Law. In addition to providing automated loan documents for private lenders, the platform serves as a source of aggregated market data. More than 51,000 loans have run through Lightning Docs so far this year, including 23,745 bridge loans and 27,268 DSCR loans, giving us one of the clearest real-time views into private lending activity nationwide. This report highlights the trends emerging from that data and offers insights lenders can use as they plan for the coming year.
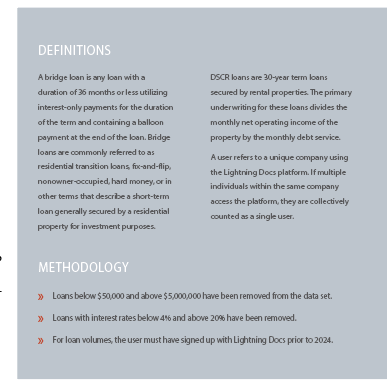
Bridge Loan Volumes
2025 has been an up and down year for bridge loans. Early in the year, bridge loan volume continued the year-over-year growth pattern many lenders had come to expect. As the industry moved into second quarter, however, activity began to cool, with several months of gradual declines.
More recent data shows signs of stabilization. In October, bridge loan volume reached its highest point in five months, hinting at a possible resurgence. Whether this becomes the start of a new upward trend or a temporary pause in a longer cooling period will depend largely on how borrowers and investors respond to shifting interest rate expectations and the continued rise of DSCR lending (see Fig. 1).
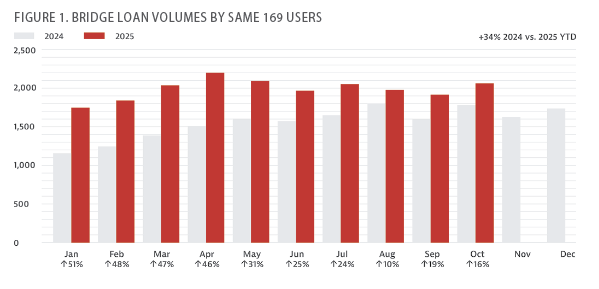
DSCR Loan Volumes
If one theme has defined the year, it is the rapid acceleration of DSCR lending. In late 2024, Lightning Docs users produced more DSCR loans than bridge loans for the first time ever. That gap has widened dramatically since.
Recent data shows 3,357 DSCR loans among that same cohort, representing 97% year-over-year growth (see Fig. 2). What was once viewed as an emerging product type has now become a central pillar of the private lending market. Lenders who have leaned into DSCR as a core offering are outpacing those who have not, capturing both volume growth and increased borrower demand.
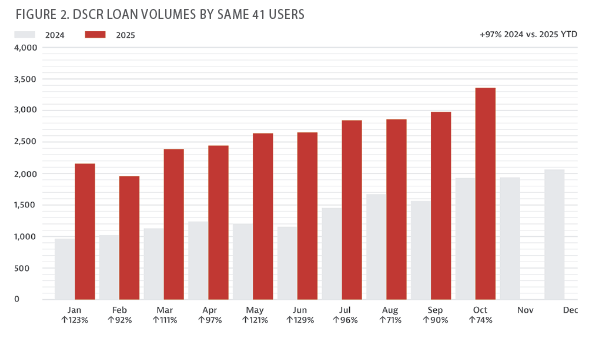
Bridge Loan Rates and Amounts
Bridge loan rates have been consistently inching downward for over a year now. Average loan amounts hit a low point of $634,000 in January 2025, then climbed to a high of $732,000 in June. As of the most recent data in October, average loan amounts sit right in the middle at around $688,000 (see Fig. 3).
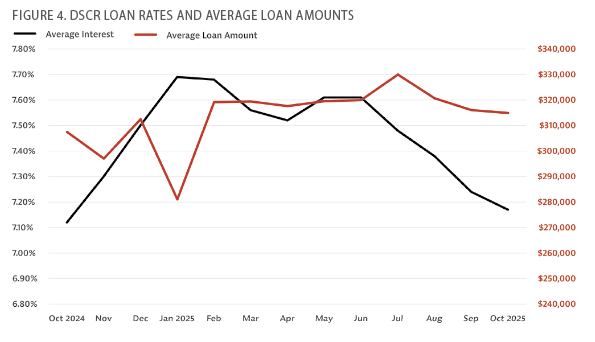
DSCR Average Rates and Amounts
Although DSCR rates haven’t been shifting downward for as long as bridge rates, the recent trend is similar. Rates have increased only once since January 2025; as of October, they’ve averaged about 7.17%. Notably, DSCR rates have gone down almost 50 basis points over four months, which correlates to a rise in volumes. Assuming interest rates continue to trend down, DSCR loans should continue to overperform as real refinance opportunities will begin to exist.
Average DSCR loan amounts have remained remarkably consistent. Throughout the past 12 months, loan amounts have generally hovered within $20,000 of the $300,000 mark (see Fig. 4).
Bridge and DSCR vs. Indexes
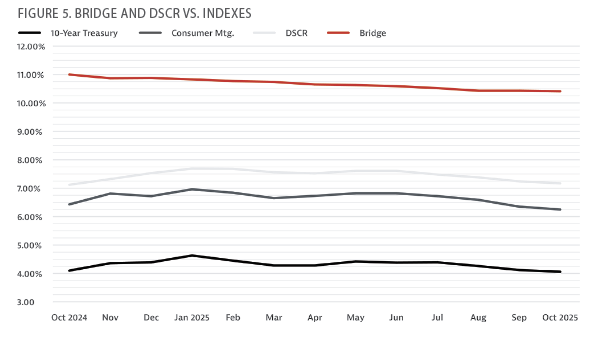
The Federal Reserve’s back-to-back rate cuts in Fall 2025 added momentum to trends that were already underway. Private lending rates and benchmark indices, including the 10-year Treasury and consumer mortgage rates, were trending downward before the cuts and continued to fall after them.
Current readings show the 10-year Treasury, consumer mortgages, and bridge loan rates at their lowest points in over a year. DSCR rates are not far behind. Even more telling, the spread between DSCR rates and the 10-year Treasury remains tight at 3.11% (see Fig. 5). That narrow gap reflects sustained investor demand and suggests DSCR will remain a highly competitive loan product moving into 2026.
Top States for Bridge Loans
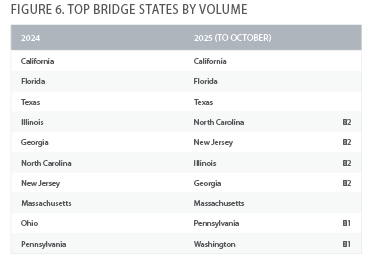
California, Florida, and Texas remain the powerhouses in bridge lending, each producing more than double the volume of fourth-place North Carolina.
But 2025 has also brought new contenders to the lineup. Washington has broken into the top 10, while New York, South Carolina, Tennessee, and Arizona are hovering just outside the rankings—primed to overtake (see Fig. 6). These markets are worth watching, as their year-to-date growth suggests growing borrower activity and potentially untapped opportunity for lenders.
Highest Bridge Loan Amounts: The Million-Dollar Markets
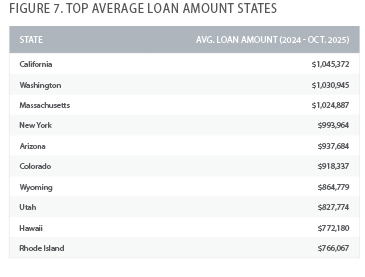
Three states—California, Washington, and Massachusetts—continue to lead the country with average bridge loan amounts above $1 million (see Fig. 7). These markets are notable not just for high deal sizes but also for their dual presence on the list of top 10 states by transaction volume. That overlap reflects both strong demand and high property valuations in these areas.
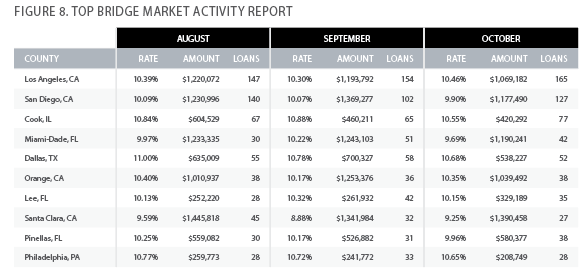
A Deeper Look into the Top 10 Bridge Markets
National trends are important to follow, but private lending remains a very localized industry. The top bridge counties illustrate just how differently markets can behave. Santa Clara, California, averages loan amounts nearly three times those of Cook, Illinois, yet in September carried an average interest rate 2% lower. Philadelphia, Pennsylvania has seen average loan amounts fall more than 20% from August to October, while Lee County, Florida, surged 31% during the same timeframe. Orange County, California, continues to produce a consistent 36 to 38 loans per month, whereas Miami-Dade remains significantly more volatile (see Fig. 8). For lenders, this local divergence underscores the value of county-level data when identifying expansion opportunities. Lenders who prioritize hyperlocal analysis may find themselves a step ahead of their generalist counterparts for all three metrics of rate setting, loan amount, and deal flow volume.
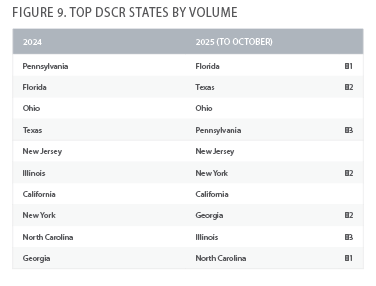
Top DSCR States
Florida has emerged as the clear leader in DSCR lending, producing more than 500 additional transactions compared with any other state. Behind it, Texas, Ohio, and Pennsylvania form a tightly grouped second tier. Just outside the top 10, states like Michigan, Maryland, and Missouri are showing steady growth and may play a larger role in the months ahead (see Fig. 9).
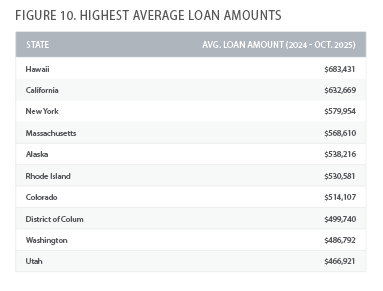
Highest DSCR Loan Amounts
The top DSCR markets mirror bridge trends in one key way: High loan amounts tend to cluster in already-competitive states. California and New York both rank in the top 10 for DSCR volume and also hold the second and third spots for average DSCR loan amounts. Hawaii stands out at the top of the list with an average DSCR loan amount of $683,431, making it the only state with an average higher than California for either loan product (see Fig. 10).
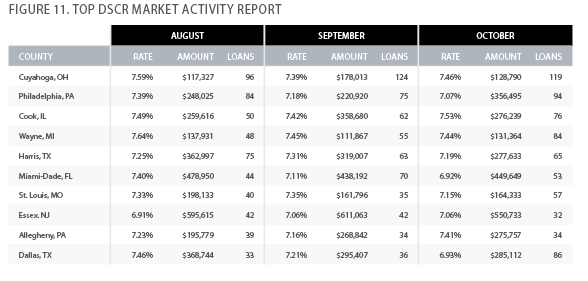
Top DSCR Counties
DSCR activity is expanding at an impressive rate across multiple major counties (see Fig. 11). Cuyahoga, Ohio, grew 24% within a recent three-month period. Cook County, Illinois, increased 52% over the same time frame. Wayne County, Michigan, rose 75%, and Dallas County, Texas, surged 160%. The widespread nature of this growth shows that DSCR demand is broad, and opportunities are available for lenders across the country.
Key Takeaways
With most of 2025’s data now available, several themes are clear. The market is experiencing a continued shift from bridge loans to DSCR, and new markets are emerging every month, creating more entry points for lenders nationwide.
Early adopters of DSCR have already realized significant business growth. Rates are declining across all major categories, and loan amounts—after early-year increases—have stabilized into predictable ranges. As lenders look ahead, the ability to identify and respond to these trends, especially at the county level, will be a major advantage in navigating an increasingly competitive private lending market.


Leave A Comment