
Authors Michael Fogliano and Sean Morgan, Forecasa
A long tail of one-time users and a small, high-velocity segment drive nearly half of private lending transactions.
We are constantly asked about how the size of the private lending industry and the number of active investors, so we decided to put together an analysis of the private lending borrower universe, relying on data from January 2022 through third-quarter 2025.
During this time, the private lending market has experienced shifts in the borrower landscape, characterized by evolving relationship dynamics between borrowers and capital providers.
Borrowers at a High Level
Figure 1 reflects a unique, normalized count of private-lending borrowers. Many real estate investors operate through multiple LLCs or single-asset entities, but for analytical accuracy, our process consolidates those entities into a single borrower record when they represent the same underlying borrower.
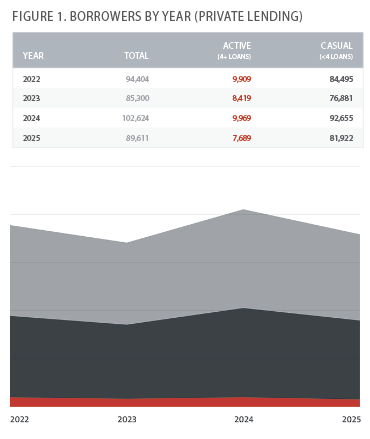
From the highest view, the data reveals that borrowers in the private lending market frequently enter and exit, creating continual churn, with a long tail of small, localized borrowers. In general, the market is highly disaggregated. Some of these borrowers may still be investing using conventional financing or personal capital, but their low annual volume makes it difficult to confirm whether they paused activity or are simply operating at the usual pace.
Most borrowers do not borrow often, and only about 26% remain active from one year to the next. Yet within this broad mix is clear bifurcation. The cumulative 2022-2025 data shows that 16.5% of lenders served 10 or more unique borrowers, indicating the coexistence of both highly specialized and more diversified lenders .
Although most borrowers complete a small volume of loans, a small but strong segment drives a big chunk of the market. Nearly 88% of all private lending borrowers work with a single lender annually, but a small cohort of professional operators tells a different story. Borrowers that close four or more loans a year, representing just 9-11% of the total borrower population, account for 29-39% of total market volume and 38-44% of all transactions.
In 2022, only 9,909 borrowers (10.5% of the market) generated $45.5 billion in mortgage originations, with an average annual volume of $4.6 million per borrower. These professional operators, likely comprised of active fix-and-flip investors, developers, and small institutional players, demonstrate fundamentally different behavior than their casual counterparts.
Active Borrowers Shop the Market
The lender relationship patterns among active borrowers stand in sharp contrast to the overall market. Although 88% of all borrowers use just one lender annually, only 39-45% of active borrowers stick with a single capital provider. Instead, the majority of active borrowers diversify across multiple lenders:
31-32% work with two lenders
23-27% work with three to five lenders
1-2% work with six to10 lenders
A small fraction even maintains relationships with more than 10 lenders.
This diversification of borrowers adding lending partners to their repertoire has accelerated. In 2022, 23% of active borrowers used three to five lenders; by 2025, that figure had climbed to 27%. Simultaneously, single-lender relationships among this cohort declined from 44% to 39%.
This behavior suggests active borrowers could be rate shopping, managing relationship capacity to avoid overconcentration with any single lender, or accessing different capital sources based on property type and deal structure. The 55-61% of active borrowers who maintain multiple lender relationships help drive competition in the market.
The count of active borrowers (those doing more than four loans annually) remained essentially flat, at 9,909 in 2022 and 9,969 in 2024, despite overall market growth. However, their share of total volume has slightly changed:
2022: 39.31%
2023: 36.11%
2024: 34.62%
In two years, active borrowers’ share of total market volume declined by nearly 5 percentage points. This change from 2022’s peak is understandable given that year’s historically low interest rates and record origination volumes. The market composition has evolved as conditions normalized through 2024. The data show a gradual evolution in market composition, with the private lending market adjusting from 2022’s exceptional conditions toward a new equilibrium.
Single-family residential properties remain the dominant asset class in private lending. In 2022, this category made up 55% of private lending mortgage transactions, increasing to 63% in 2025. But we’ve also observed a notable shift toward vacant land transactions. Vacant land deals have more than doubled as a percentage of total transactions, from under 4% in 2022 to 9.4% in 2025.
Vacant land deals typically signal ground-up construction or land banking strategies, which involve longer hold periods and more complex execution than traditional fix-and-flip projects. Development activity also carries implications for risk profiles and capital requirements, as vacant land loans typically require lower loan-to-value ratios, longer maturity dates, and more sophisticated underwriting than other deals.
Pursuing larger, more capital-intensive development projects rather than high-velocity rehab deals could impact transaction velocity for borrowers, but we have not seen this happen yet. Active borrowers have consistently averaged eight to nine deals per year since 2022.
Market Growth
After a challenging 2023 that saw total mortgage volume decline 18% to $93.1 billion, the market rebounded strongly in 2024 with $109.8 billion in originations, an 18% year-over-year increase. The number of active borrowers surged 20%, from 85,300 to 102,624.
The momentum appears to be continuing into 2025. Through the third quarter, the market recorded $90.5 billion in volume across 89,611 borrowers. If the fourth quarter maintains typical seasonal patterns, 2025 could potentially surpass 2024’s total volume.
Lender Expansion
Although borrower counts have fluctuated, the number of active private lenders has grown steadily, rising from 8,294 in 2022 to 11,868 through third quarter 2025, a 43% increase. This expansion in lender supply, combined with relatively stable borrower demand, has intensified competition.
With more lenders competing for a similar pool of borrowers, many are forced into more specialized niches or single-borrower relationships. The average number of borrowers per lender has declined from approximately 11 in 2022 to about eight in 2025. Each quarter, Forecasa identifies more than 400 brand- new lenders entering the industry. Some may only be lending to friends and family and some may be brokers now funding deals directly, but others grow quickly into significant players. A few examples of these would be Maverick Lending Solutions LLC (Q4-24), Little Guy Loans LLC (Q1-25), Cedarline Lending (Q2-25), Tier One Funding (Q3-25), and Velocap Solutions LLC (Q4-25).
Despite 43% growth in the total lender count and increasing fragmentation at the long tail, market concentration among leading players has remained remarkably stable. The top 10 lenders have maintained consistent market share throughout the period (see Fig. 2).
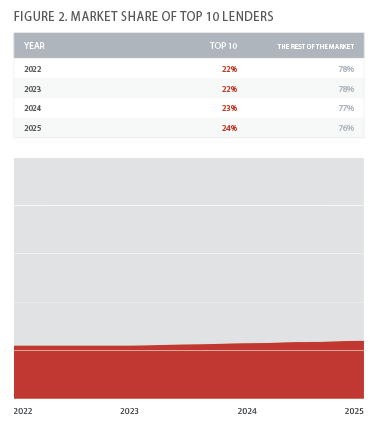
This stability shows that although new entrants and smaller lenders enter the tail of the market, the largest private lenders have maintained their competitive positions. Scale and experience continue to provide competitive advantages even as the long tail remains fragmented.
With 43% growth in active lenders while borrower counts remain relatively stable, competition has increased. Overall, this landscape suggests opportunities for lenders who can build lasting relationships with the small cohort of repeat borrowers while efficiently serving the large population of one-time users.


Leave A Comment