
In the changing lending landscape, private lenders have three basic options when originating loans. Which option is best for you?
The terms “data” and “analytics” have become ubiquitous for good reason. Within every industry, there has been a huge shift from reliance on personal networks to gather anecdotal information to a more tech-savvy approach to capture data points.
Collecting data just because it’s the recommended thing to do won’t help you run your company, however. It takes time and effort to curate the data into a usable format to generate real analytics that you can rely on to make strategic decisions about how to run your business.
This is especially true in the private lending business. For the past four years, our team has been gathering, cleaning, and analyzing residential real estate data sourced from county land record transactions, with a special focus on activities within the private lending space. With investors, originators, and capital partners recording documents under different entities, it’s hard for you to measure true activity when looking at the data in its raw format.
Our team uses a proprietary method we developed to normalize the party names and localized transaction type nomenclature for a clearer view of the true activity occurring daily. From these inputs, you can examine the various capital markets strategies used within this otherwise opaque industry.
Setting the Stage
We define private lender as a mortgage originator offering short-term fix-to-flip/bridge loans, 30-year DSCR loans (30-year rental loans), ground-up construction, and/or multifamily loans to residential investors. Based on this definition, the underlying transactions are reviewed to ensure the lenders we tag as ”private lenders” are truly private lenders. After identifying the private lenders and tagging them, we can aggregate and analyze the data to create visibility into the private lending market. Although other lenders may offer these products, we exclude them from this tag and categorize them into their own buckets (e.g., conventional, non-QM, etc.).
Market Snapshot
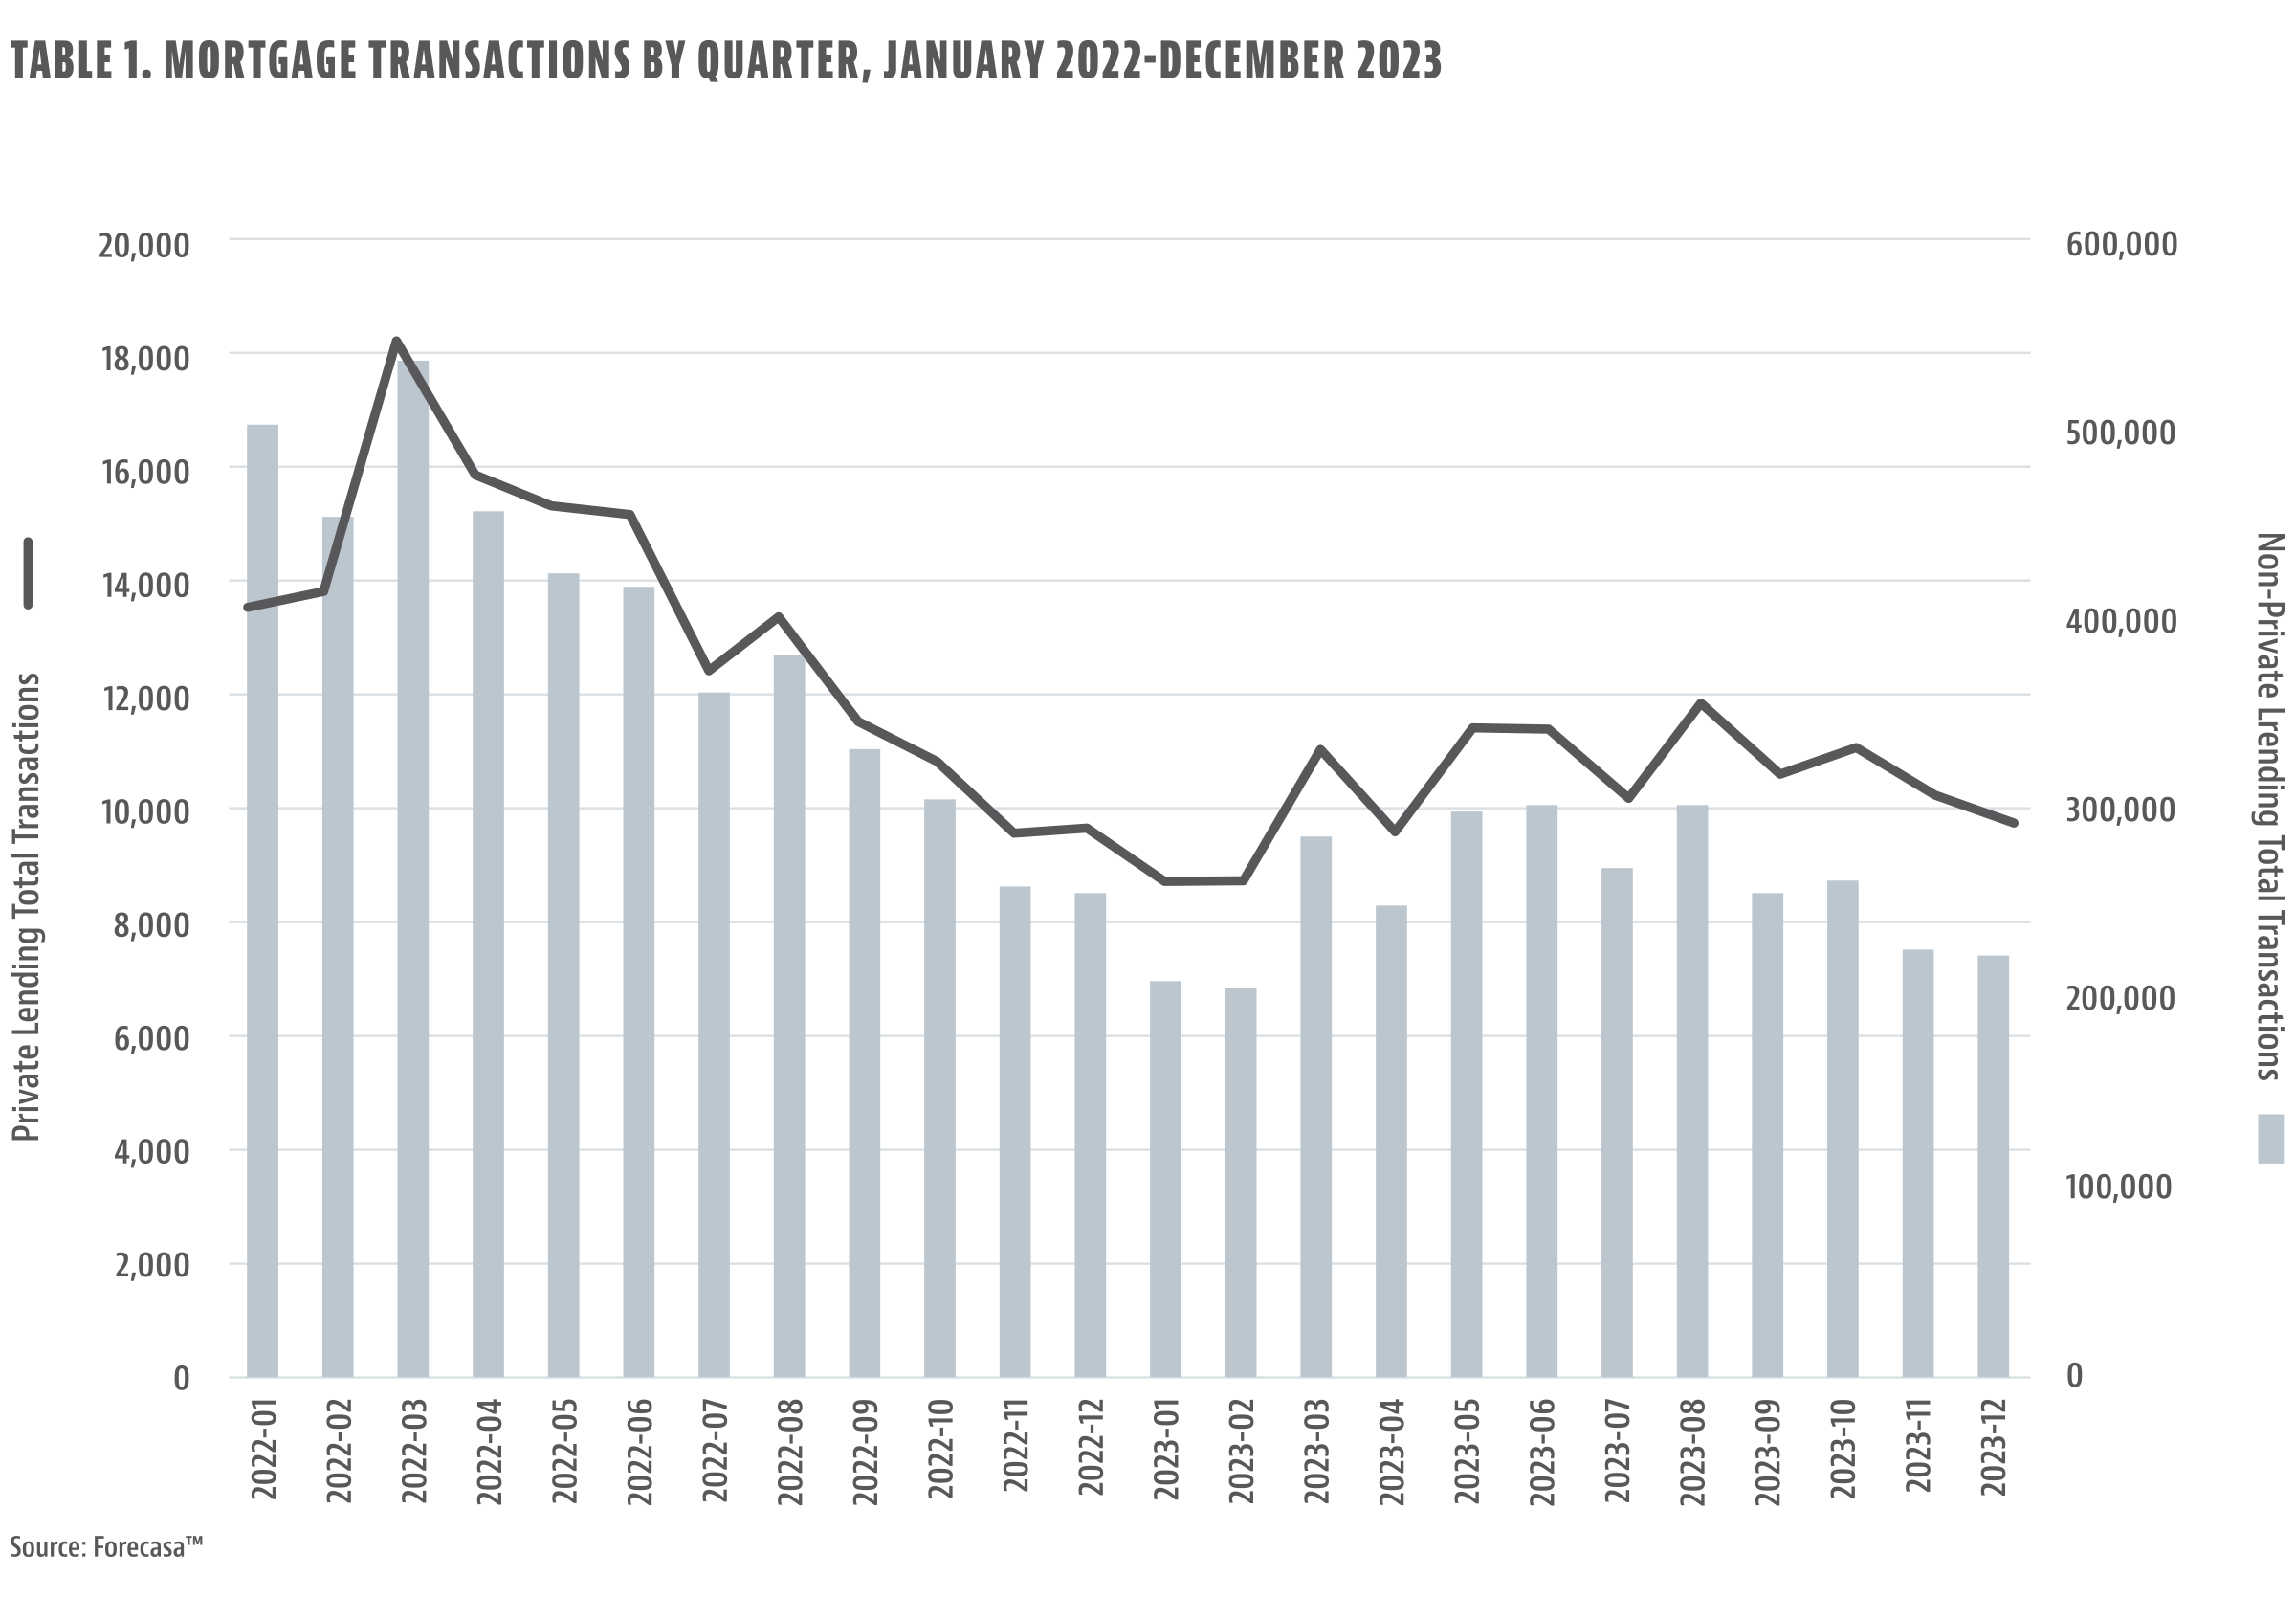
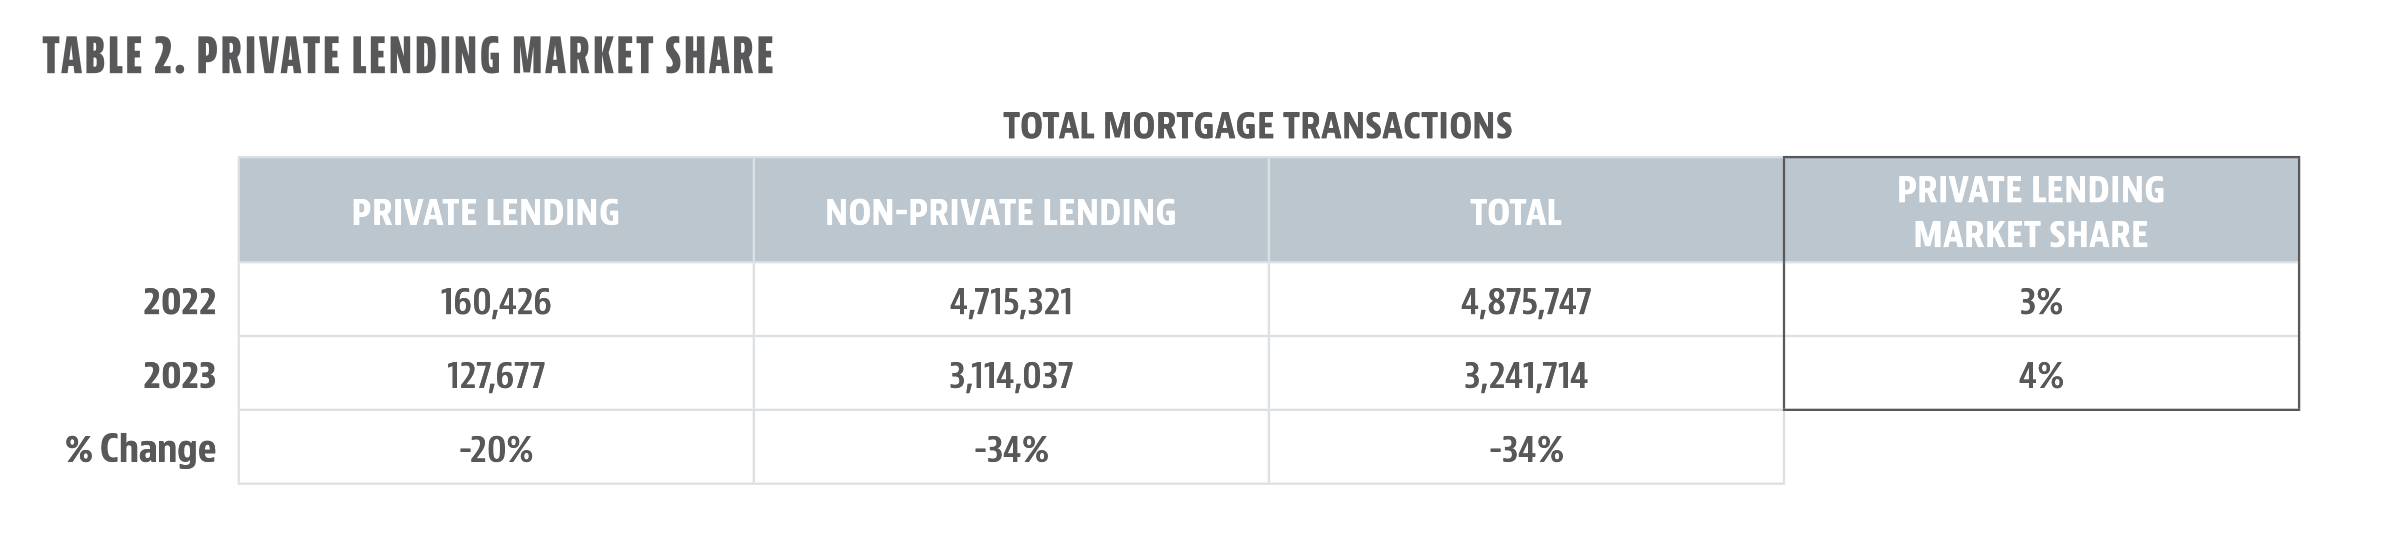
The size and composition of the private lending market has changed during the last two years. In absolute terms, mortgage activity has been down across the board, as noted in tables 1 and 2. However, private lending has grown its share of the pie. In 2023, private lending made up 4% of all mortgage loans, compared to 3% in 2022. This is because non-private lending (-34%) took a much bigger hit than private lending (-20%) year over year.
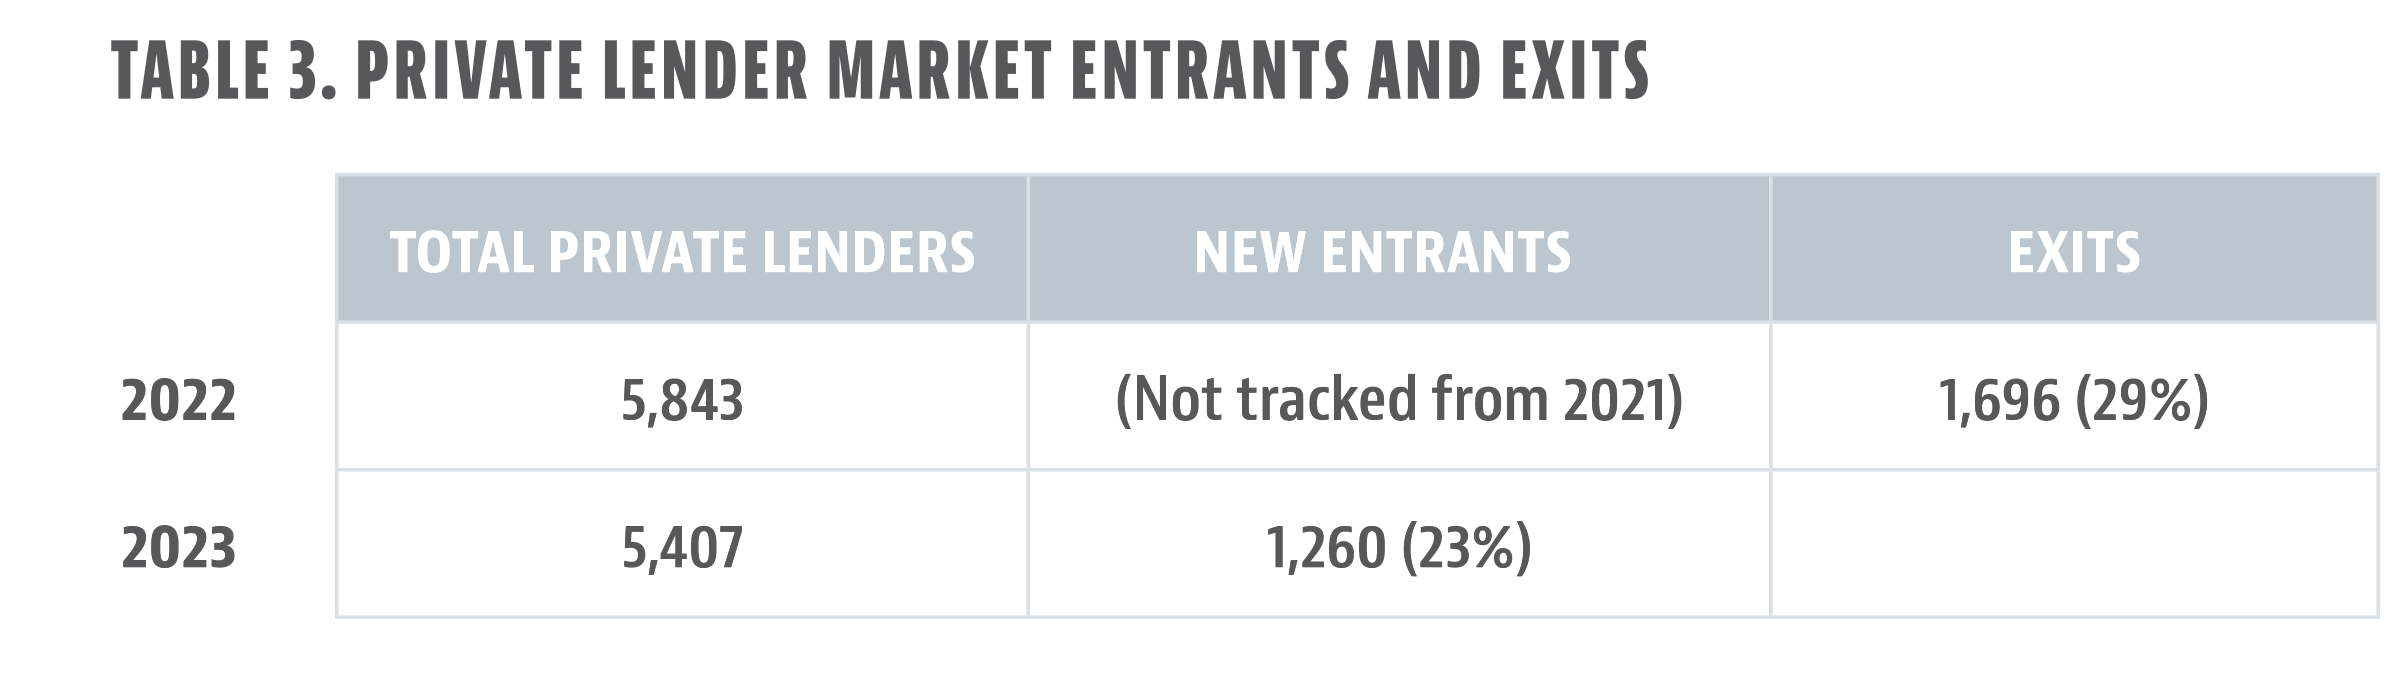
The composition of the market has also changed, as noted in Table 3. In 2023, we identified 5,407 active private lenders. Twenty-three percent of these lenders were new entrants to the market. In other words, nearly one-fourth of private lenders with originations in 2023 originated no loans the previous year. At the same time, nearly 30% of private lenders in 2022 exited the market.
The private lending industry is a highly disaggregated market—the top 10 lenders account for only 23% of private lending loan originations in 2023. This typically averages around 25% for private lending since 2019. Additionally, 51% of the loans came from lenders with fewer than 100 loans originating in 2023.
Capital Strategies: Private Lender Loan Exits
In the changing landscape, private lenders have a few options when originating loans:
- Securitize
- Originate to sell
- Balance sheet loan via fund/bank warehouse line
The biggest players can originate to securitize, but new players have been entering this otherwise limited group.
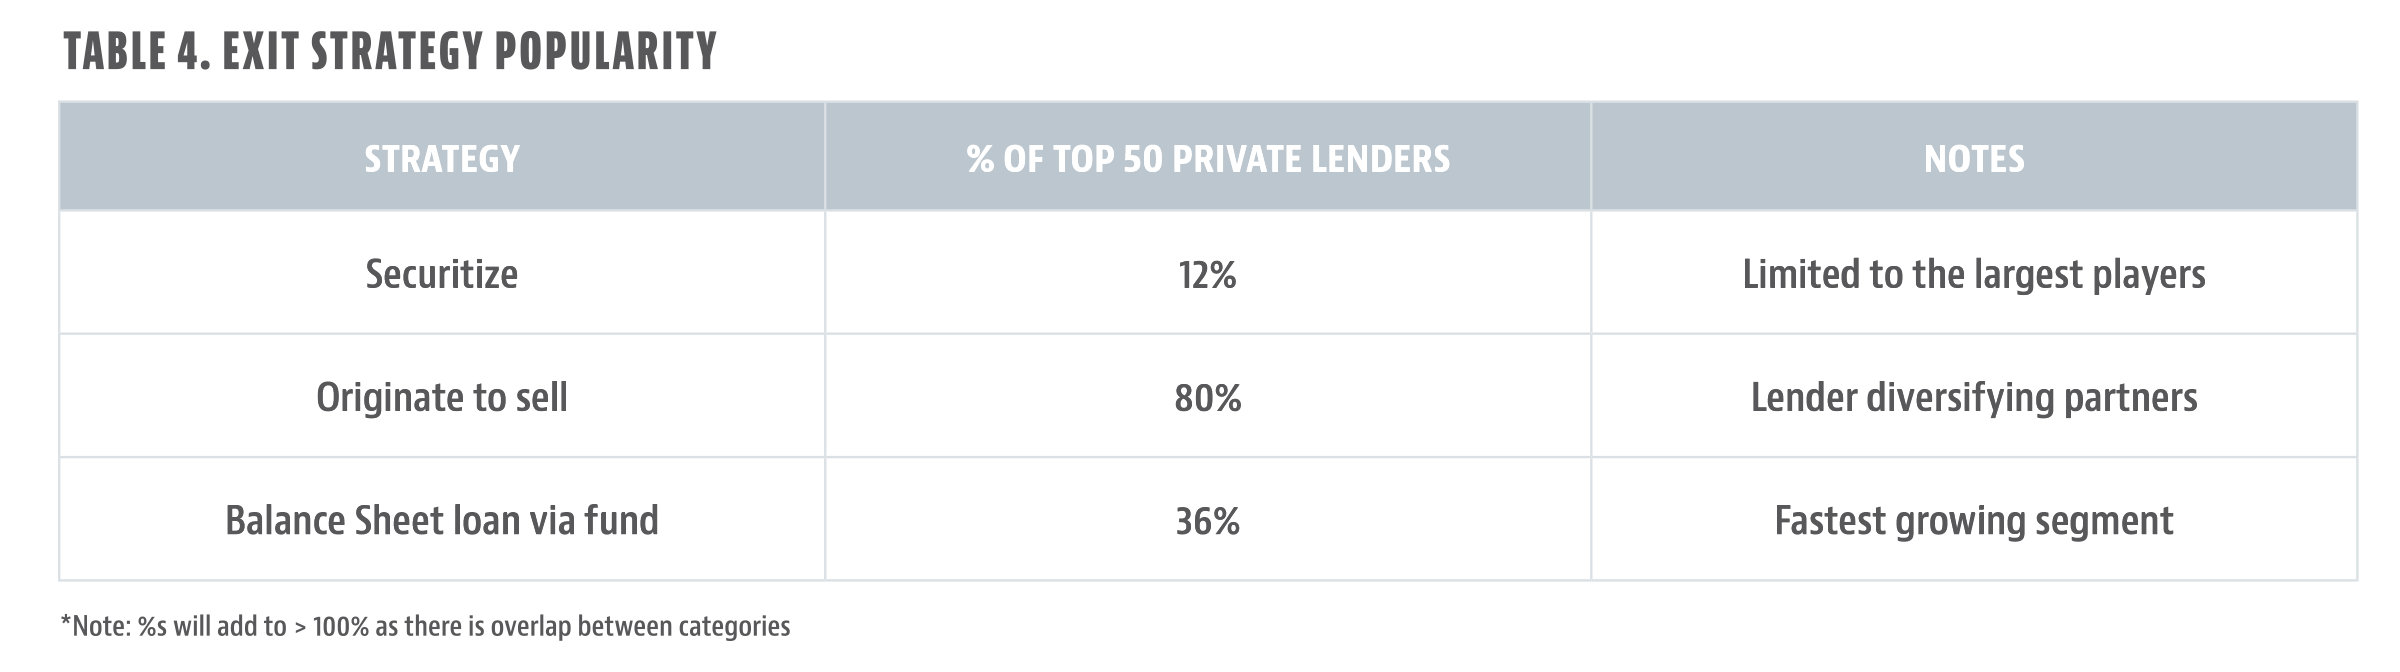
The most widely used strategy, noted in Table 4, is originating to sell on the secondary market. However, in third quarter 2022, many originators experienced offtake issues with the secondary market due to the quickly rising interest rate environment. There are only soft commitments that exist between the originators and the secondary market, which can cause sudden and impactful decisions for capital markets teams throughout the space.
This lack of assurance has led to more lenders establishing a fund via Form D filing with the SEC to raise their own capital.
Strategy Tradeoffs: Volume vs. Stability
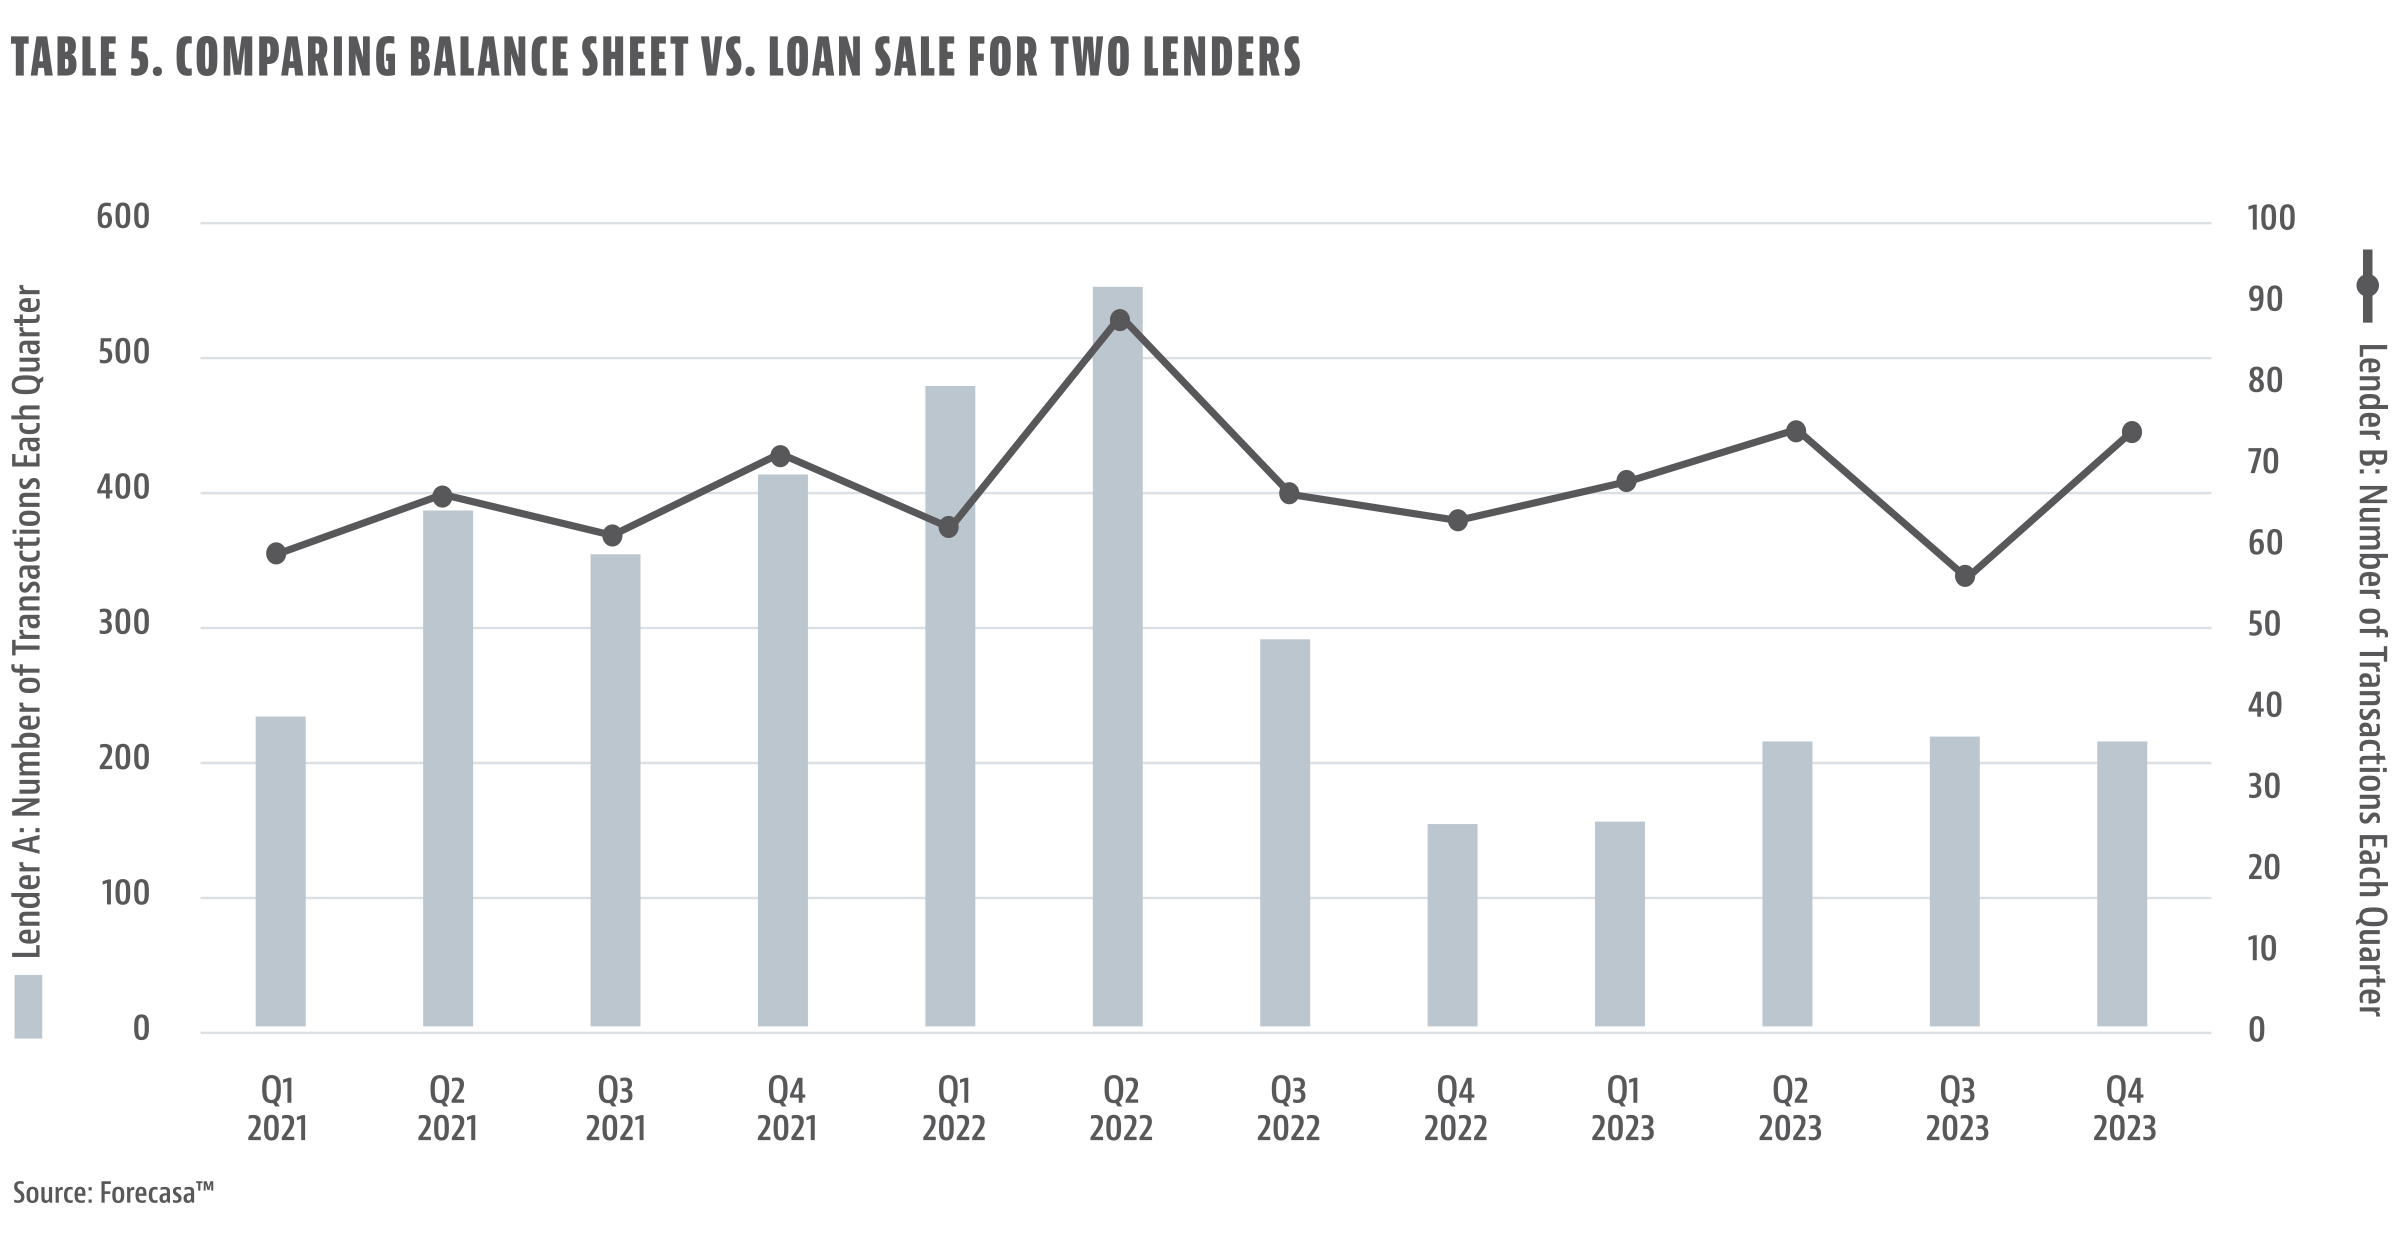
Generally speaking, lenders who had funds experienced a more stable 2022 and start to 2023 in terms of loans originated. The regional players with their own funds were able to maintain activity levels more consistently than those with high leverage on the secondary market (see table 5).
Of the top 100 private lender funds, the following shows how long they have been around as well as the median size of the funds:
- Less than 12 months: 21%
- 12-24 months: 12%
- 24+ months: 67%
Median Number of Investors: 39
Median Total Offering Amount: $50 million
Table 5 provides examples of two real private lenders:
Lender A: Lender that sells 90% + of their loans.
Lender B: Regional lender from the Midwest that keeps all loans on the balance sheet through funding they raised via their Form D filing.
As Table 6 notes, there has also been a shift away from exclusive relationships pertaining to loan buyer/loan seller activity. In 2022 and prior, it was common for an originator to have one or potentially two active note buyers.
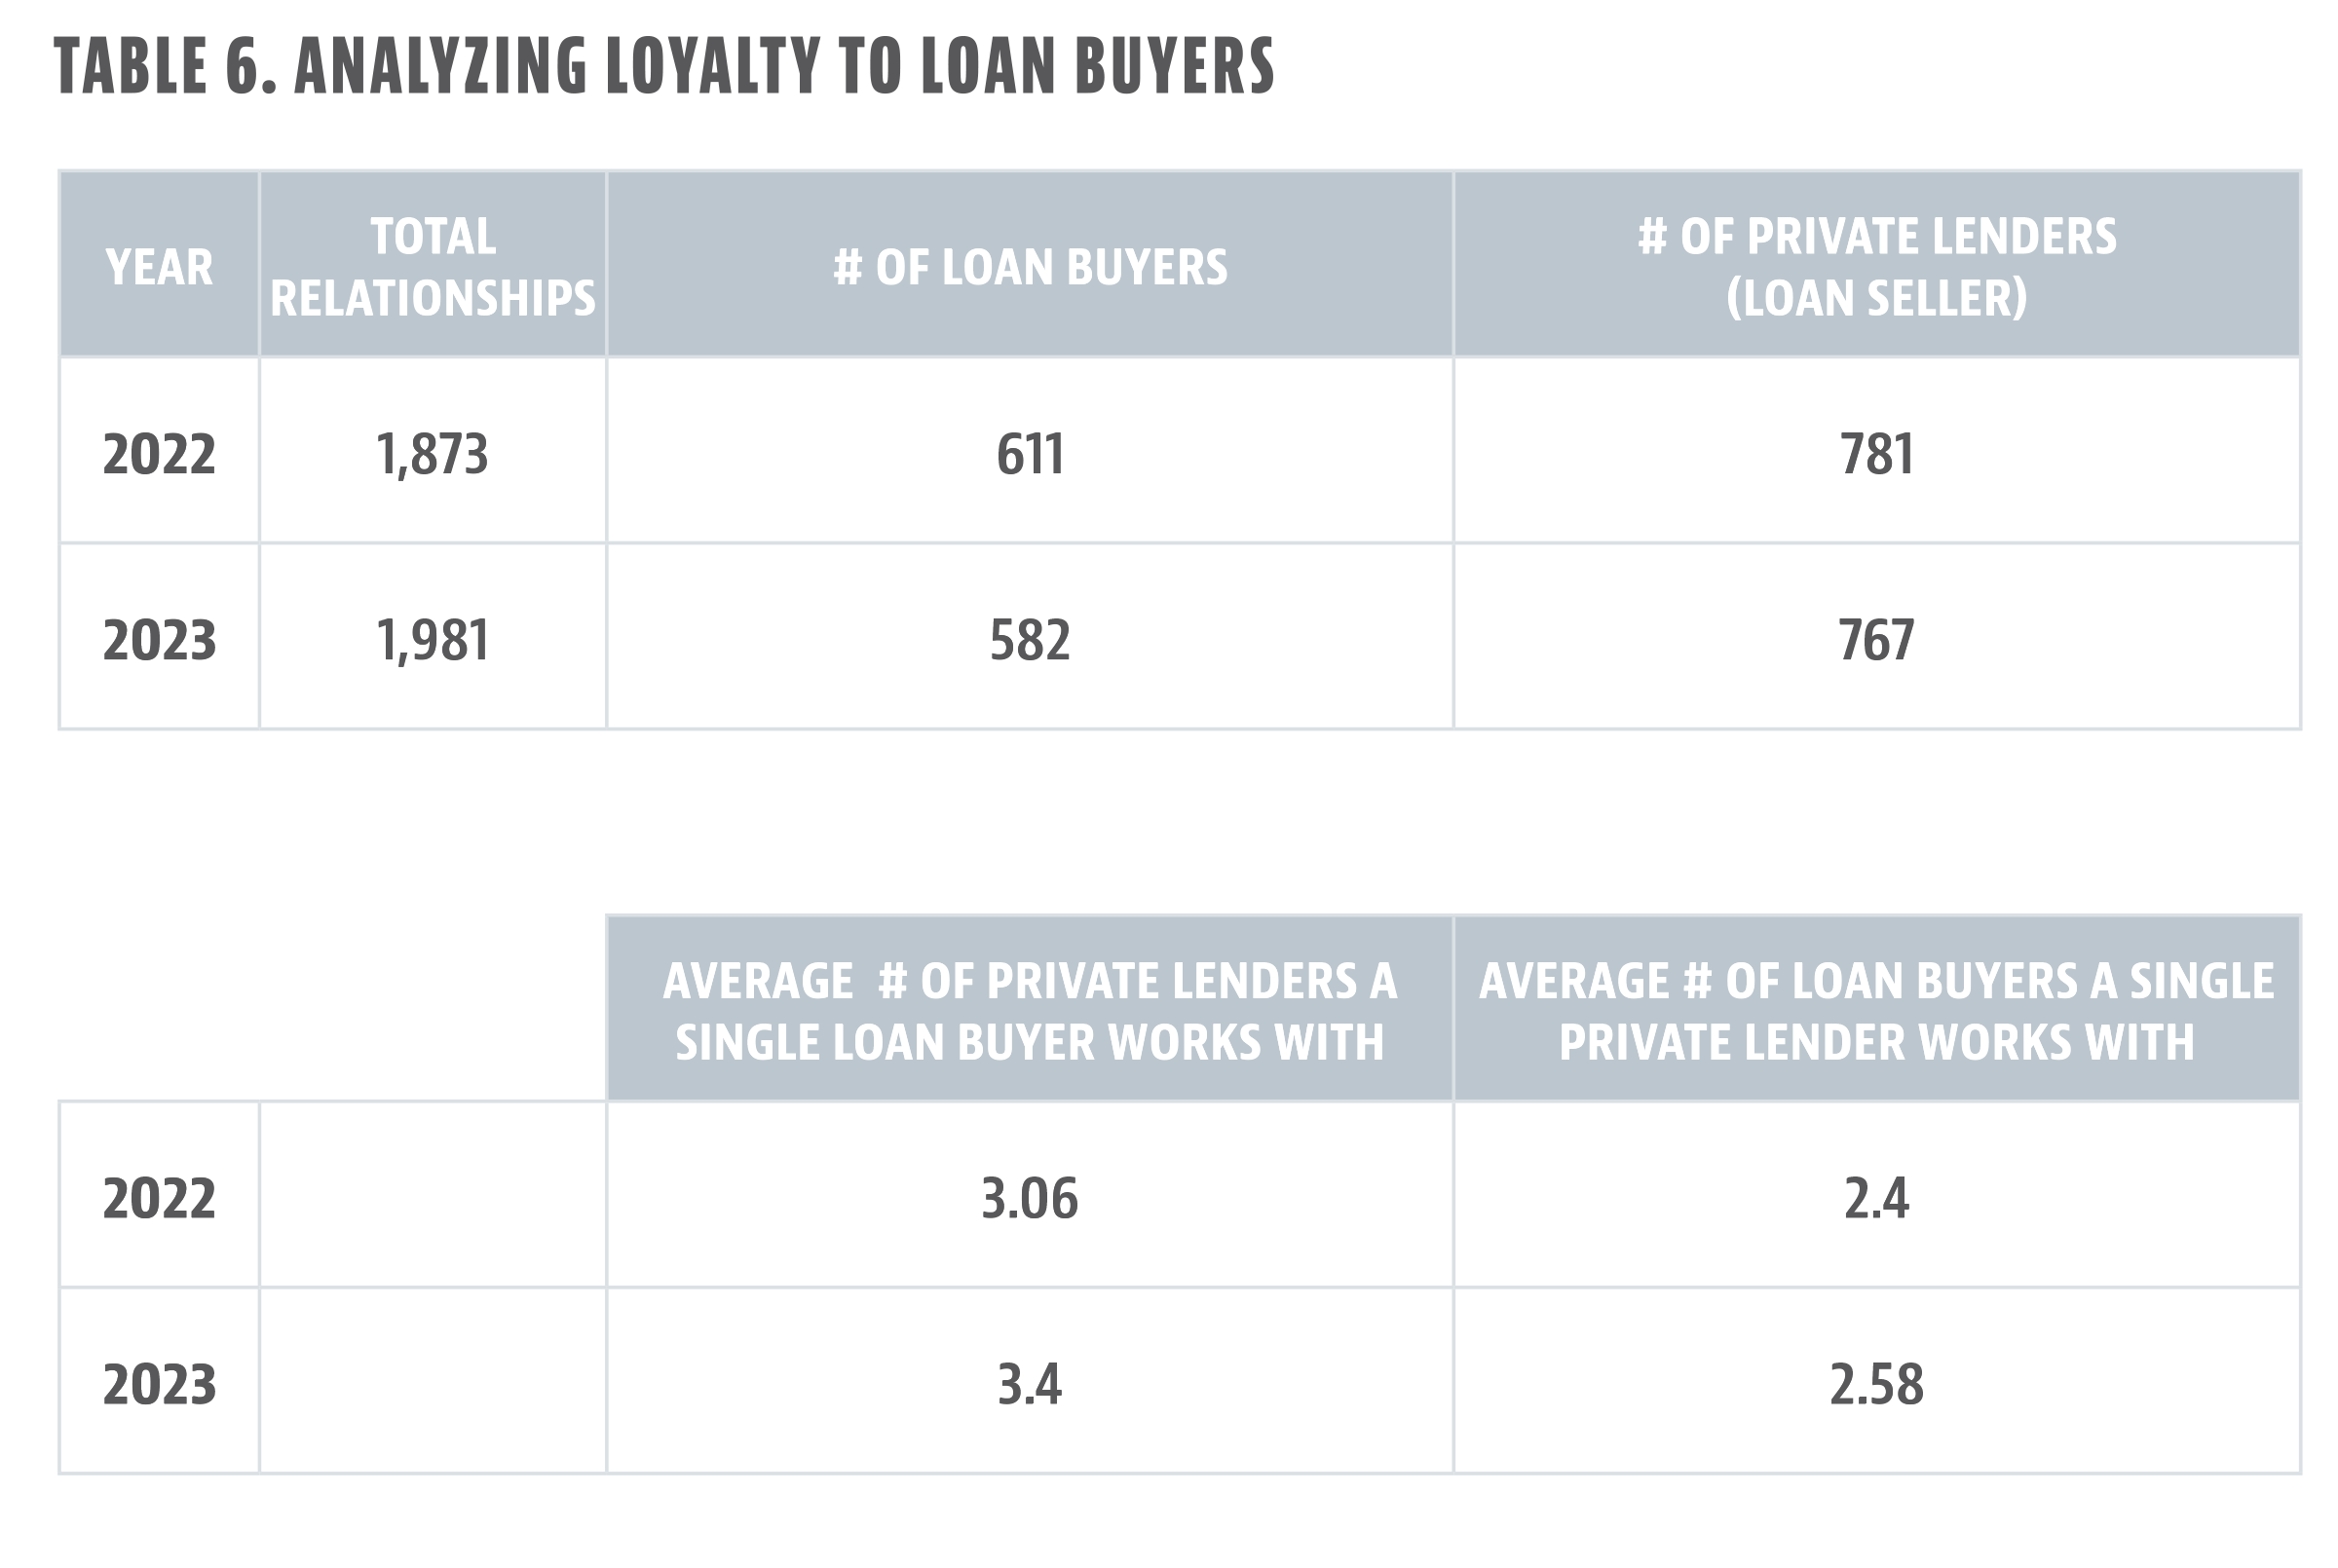
Toward the end of 2022 and throughout 2023, originators did a better job of diversifying their capital markets risk by increasing their number of active capital relationships. Whether it will be with loan aggregators, local banks, insurance companies, etc., we expect this trend to continue because most of these relationships are not contractual/guarantees to buy.
In summary, private lending is down from its peak in March 2022 but is growing relative to conventional lending. Capital markets teams for the originators have had their work cut out for them during the past 18-24 months but have done a good job securing new options to fund their originations. We expect this trend to continue as more of the larger originators focus on TPO strategies.


Leave A Comment