
Legislation aimed at deterring “property speculation and flipping in vulnerable neighborhoods” in New York City begs the question: Just how prevalent and harmful is home flipping in the five boroughs that would be impacted by the policy change?
An Auction.com analysis of public record data from ATTOM Data Solutions shows home flipping in the five boroughs of New York City is on the decline, and the rate of home flipping in the five boroughs is lower than the home flipping rate statewide and nationwide.
Furthermore, while it certainly holds true that home flipping is speculative in nature—using the Oxford definition of speculative as “involving a high risk of loss”—the analysis demonstrates that investors are shouldering the bulk of the risk involved with this speculation, even while stabilizing neighborhoods by renovating distressed housing stock, improving home values and providing inventory that is more affordable than the overall real estate market.
Before diving further into the analysis of home flipping data in New York City, it’s worth providing a quick overview of the legislation. Titled the New York State Small Home Anti-Speculation Act, New York State Senate Bill S3060E would amend the administrative code of the city of New York to impose an additional transfer tax on properties sold within one or two years of a previous sale. The bill would impose an extra 20% tax on the transfer of properties that occur within one year of the previous transfer, and an extra 15% tax on the transfer of properties that occur within two years of the previous transfer.
NYC Flipping Below Average
A total of 874 homes were flipped—sold for the second time within a 12-month period—in the first 11 months of 2019 in the five New York City boroughs. That’s down 6% from the same period in 2018, according to the ATTOM data. Those 874 home flips represented 5.6% of total home sales in the five boroughs in the first 11 months of 2019, below the 5.8% home flipping rate statewide and the 6.3% home flipping rate nationwide.
The number of home flips in New York City climbed to an 11-year high in 2018, but the decrease in 2019 is likely due to shrinking potential profits for home flippers—a trend also playing out nationwide, according to the ATTOM Q3 2019 U.S. Home Flipping Report. That report shows gross home flipping returns nationwide hovering around 40% in 2019, the lowest level since 2011. Gross home flipping returns in New York City are higher, at 63.1% in 2019, but similarly at the lowest level since 2011.
Foreclosure-Heavy Flipping
Although on the decline, gross home flipping returns in New York City are well above the national average because home flippers there are taking on a higher percentage of foreclosure properties. Nearly half (49%) of all properties flipped in New York City in 2019 were originally purchased by the real estate investor at foreclosure auction or as a bank-owned foreclosure (REO). That’s compared to only 28% nationwide. Statewide in New York, 52% of 2019 home flips were originally purchased in foreclosure.
Foreclosure properties tend to be in distressed condition, which translates into bigger potential discounts at purchase. But it also means more extensive property repairs that come with higher rehab and holding costs.
This all bears out in the data. In New York City, the average purchase discount for homes flipped in 2019 was 30% below full “after-repair” market value of the home. That was well above the average purchase discount of 24% for homes flipped nationwide in 2019, although it’s a bit below the average purchase discount of 33.3% statewide in New York.
21 Percent Longer to Flip
The bigger upfront discount available with distressed foreclosure properties in New York City comes with a cost: The average home flip completed in New York in 2019 took 216 days, 37 days longer than the nationwide average of 179 days.
The 21% longer it takes to flip a home in New York City means higher holding costs—think property taxes, utilities, basic property maintenance and financing costs. It also implies more extensive (and expensive) rehab, given that a home flipper is motivated to sell as soon as possible after completing any property renovations.
62 percent Purchased with Cash
Purchasing distressed foreclosure properties comes with another cost that may not be as immediately obvious: lack of available financing. At most foreclosure auctions, winning bidders are required to pay in cash on the spot, and lenders are less likely to approve financing on highly distressed REO properties. This lack-of-financing feature of foreclosure purchases means that a higher percentage of New York City home flippers are purchasing with cash: 62% in 2019 compared to 57% nationwide.
The high percentage of cash purchases on eventually flipped homes has two other important implications. First, buyers who pay with their own cash are taking on more risk than financed buyers, who share the risk with their lender. Second, most retail, owner-occupant buyers would not be able to purchase a foreclosure property even if they wanted to because most don’t have six figures in cash sitting around for use on a home purchase.
Efficient Return-to-Retail
Given these implications, cash-buying home flippers act as an important and necessary bridge between the distressed and retail markets, particularly in areas like New York City with more legacy foreclosures.
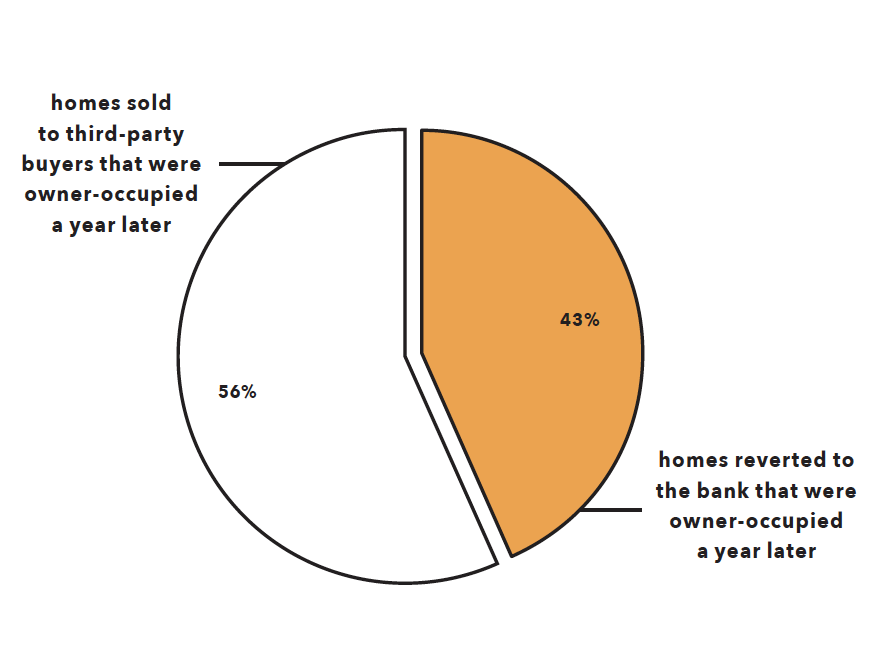
This distress-to-retail bridge is evident in national data from the Auction.com Q2 2019 Distressed Seller Strategy Report, which looked at what happened to more than 9,000 properties sold to third-party real estate investors at foreclosure auction in second quarter 2018. The report found that 56% of those properties were in the hands of owner-occupants a year after the foreclosure auction. By comparison, only 43% of homes that reverted to the bank at foreclosure auction (REO) were owner-occupied a year later, indicating real estate investors are much more efficient than banks at returning distressed properties to the retail market.
Flipped Homes More Affordable
Surprisingly, the investor return-to-retail function does not come with a home affordability penalty. On the contrary, homes sold by home flippers in New York City sold at a lower price point, and lower price-per-square foot than the overall retail housing market.
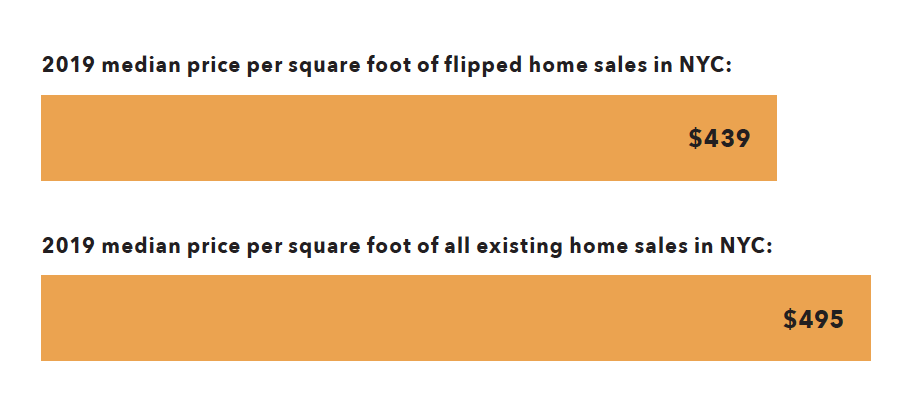
New York City homes flipped in 2019 sold at a median price of $565,000, 14% below the median sales price of $660,000 for all existing home sales in New York City in 2019, according to an Auction.com analysis ATTOM home price data. The flipped discount was also in double digits on a price-per-square-foot basis: $439 per square foot for flipped homes, 11% below the $495 per square foot for all existing home sales.
Considering all this data, it’s appropriate to revisit the original question posed in this article: Just how prevalent and harmful is home flipping in New York City?
The short answer is this: Home flipping is rare in New York City compared to other markets. And, rather than being harmful, home flipping in the five boroughs is helping to efficiently renovate and return distressed housing stock to the retail market at a relatively affordable price point.
Infographic
It’s infographic time. Here’s a visual review of New York City’s flipping market and the impacts Senate Bill S3060E will have on the market.
For the purposes of the data set, a “flip” is any property that transfers ownership for the second time within a 12-month period, with the second transfer being an arms-length (regular market) sale.
Here are the key points.
NYC housing purchased from flippers is more affordable than traditional alternatives: Flippers provide a cost-per-square-foot discount of 11% over homes purchased from nonflippers.
- In 2019, the median sale price of a flipped home in NYC was $565,000, with a median price per square foot of $439. That compares to a median price of $660,000 and median price per square foot of $495 for all existing home sales in NYC.
The flip tax would also hurt local businesses and trade jobs, likely pulling at least $46 million away from local renovation support industries such as construction, roofing, plumbing, etc.
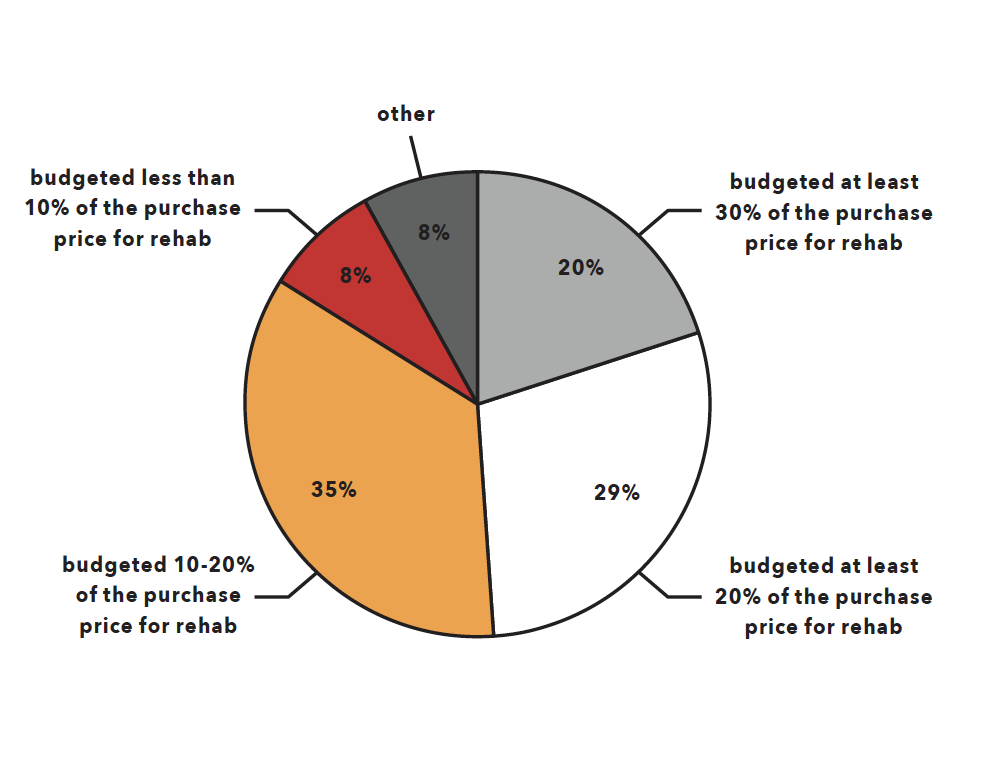
- com’s 2019 Buyer Insights Survey Report estimates that 20% of flippers budget at least 30% of the purchase price for rehab, with 29% of flippers budgeting at least 20% of the purchase price for rehab, 35% budgeting at between 10-20% (conservatively rounded down to 10%) and 8% budgeting less than 10% (conservatively rounded to 0%). The remaining 8% responded “other.”
- Based on flips’ median purchase price of $346,500 and 874 flips in 2019, this means that NYC flippers budgeted around $46,334,673 in renovations.
Flippers are taking on distressed properties and adding value through extensive repairs and renovation. This helps raise the values of surrounding properties and neighborhoods and increases revenue from property taxes.
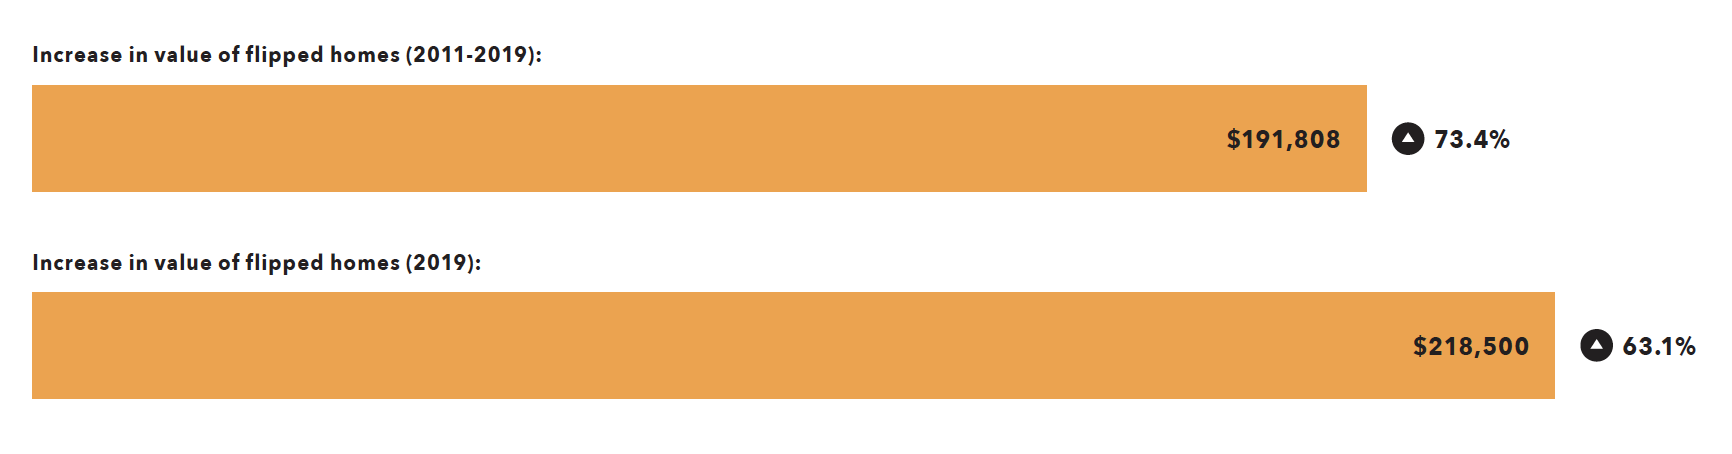
- From 2011 to 2019, NYC home flippers sold properties for $191,808 more than they purchased them for, an increase in value of 73.4%. In 2019, NYC home flippers sold for $218,500 more than they purchased, a 63.1% increase in value.
- From 2011 to 2019, NYC home flippers purchased at a 36% “discount” below full “after-repair” market value, and they sold for a 7% premium above market value. In 2019, NYC home flippers bought at a 30% discount and sold at an 8% premium.
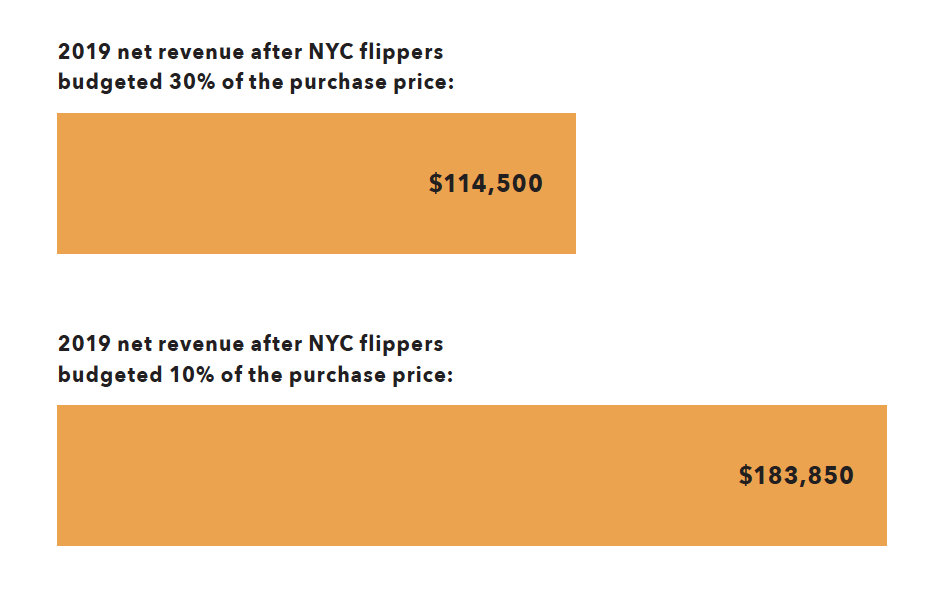
In 2019, New York City flippers likely made between $114,550 and $367,700. These figures do not include flip holding costs and business operational expenses.
- The average New York City flipper likely only flips one or two properties per year. Of the 765 flips in NYC in 2019, 682 were by unique flipping entities, which implies 1.12 flips per flipper (although it is possible some flippers operate under multiple entities).
- Based on a 2019 NYC flipper median gross sale price of $218,500 more than the purchase price and the purchase price percentage that flippers budget per renovation from Auction.com’s 2019 Buyer Insights Survey, NYC flippers budgeting 30% of the purchase price make back around $114,500 per flip, with flippers budgeting 10% making around $183,850.
Flippers get distressed properties into the hands of owner-occupied homebuyers faster and at a higher rate than banks.
- From 2005 to 2019, 24% of all NYC flipped properties were originally purchased by the home flipper in some stage of foreclosure: default, foreclosure auction or bank-owned (REO). In 2019, 49% were purchased in some stage of foreclosure in NYC.
An Auction.com analysis of more than 9,000 U.S. homes sold to third-party buyers at foreclosure auction in second quarter 2018 shows that a year later, 56% were owner-occupied. By comparison, only 43% of properties that reverted to the bank at foreclosure auction (REO) were owner-occupied a year later.
If the flip tax succeeds in killing the NYC flipping industry, it won’t affect just flippers. It also impacts lenders, both institutional and private.
- From 2005 to 2019, 54% of NYC home flippers have purchased with cash, while 46% have used financing to purchase. In 2019, 62% are purchasing with cash, while 38% are using financing.
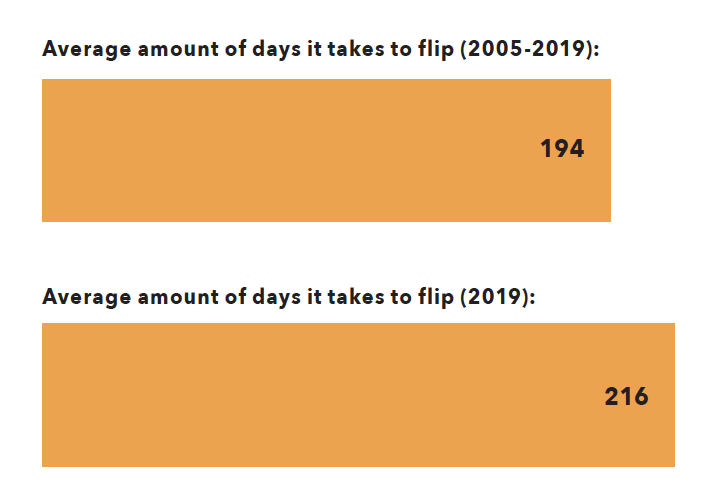
Almost all flippers would be hit by the 20% NYC flip tax, reselling in just an average of 216 days.
- It takes an average of 194 days to flip in NYC based on 2005 to 2019 data, with an average of 216 days to flip in 2019.
Overall, SB3060E is misguided, creating more issues than it purports to solve. The tax will not only kill the flippers but also funders and construction-related trades. Further, it will diminish, if not eliminate, some of the more affordable housing in New York City.
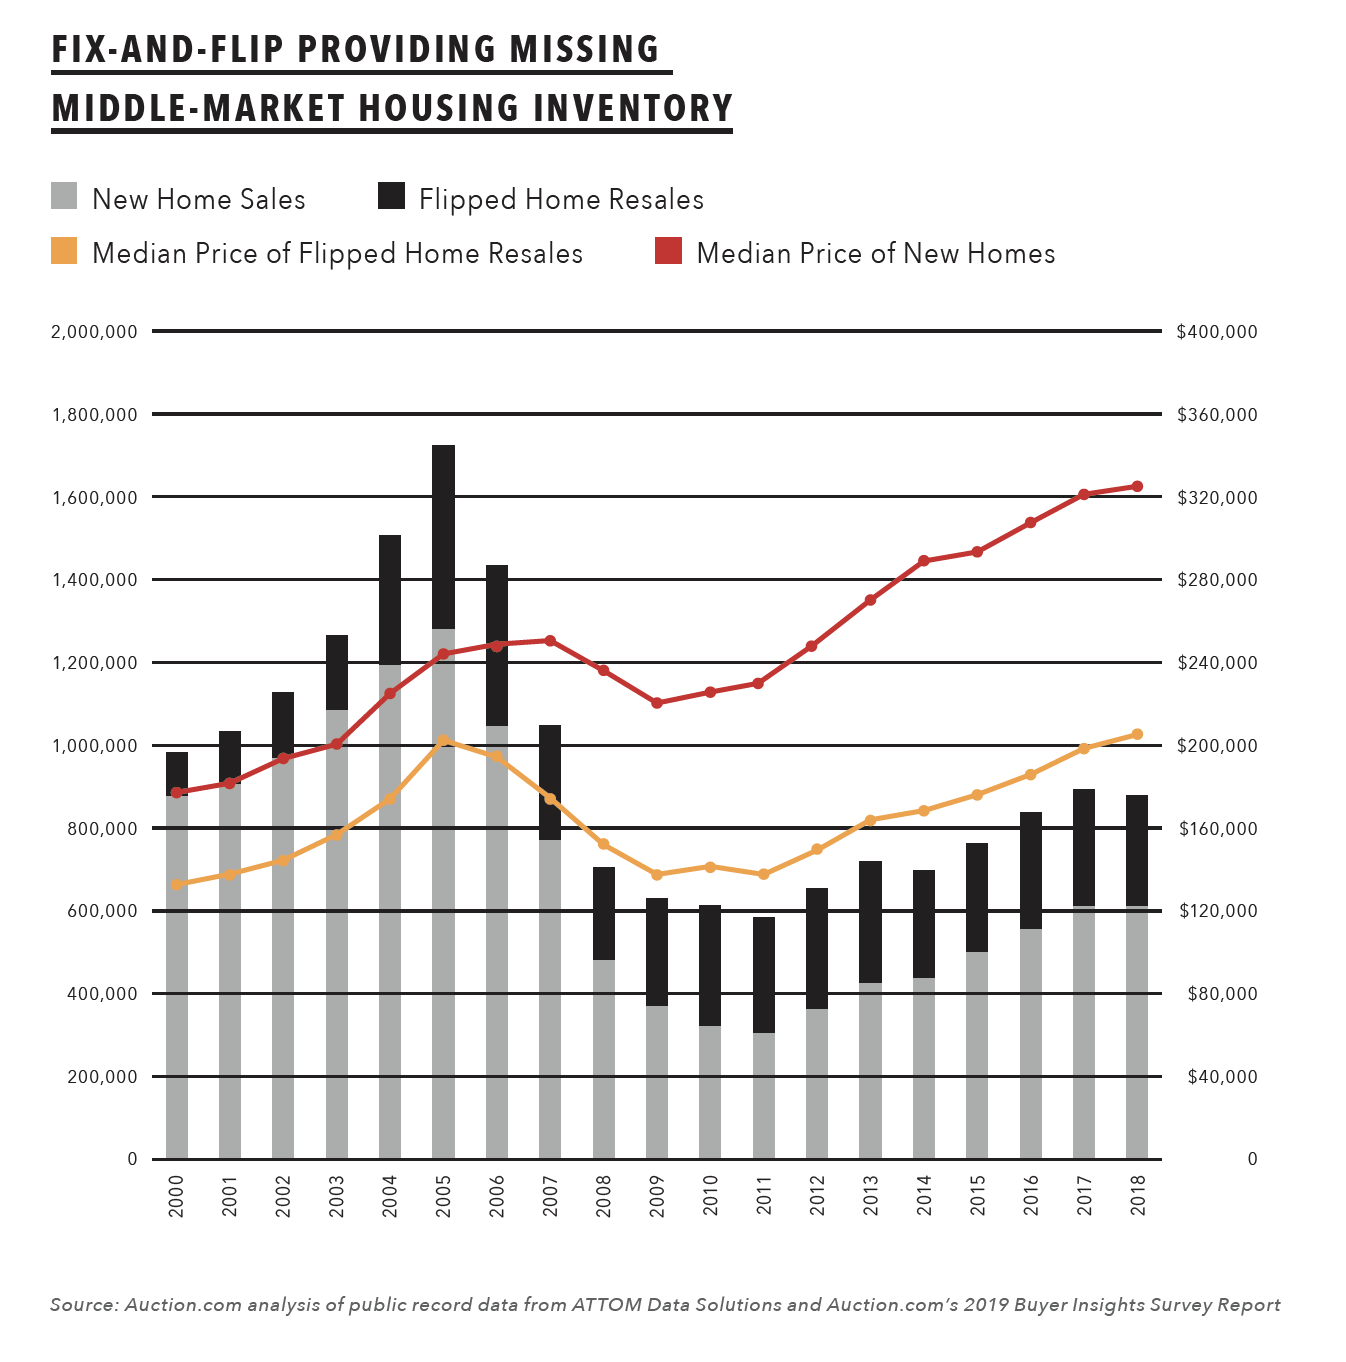
Fix-and-flip Providing Missing Middle-Market Housing Inventory


Leave A Comment