
The rising cost of materials and labor combined with a pinch in the skilled trades and supply chain have made it increasingly important for lenders to determine whether a borrower’s plan for a property is reasonable.
Those who are truly great and those who are truly humble share at least one important thing: They are honest with themselves, about themselves, and about the world around them. Instead of approaching each day, each deal, and each situation with preconceived beliefs, they approach it with openness, curiosity, and intellectual honesty.
As an industry, private lending for residential real estate serves an interesting market segment. The borrower base of residential real estate investors is constantly churning. In historical studies, companies like Carrot.com and BiggerPockets have found or estimated that 87%-95% of investors are no longer active in residential real estate business after two years.
Take a minute to reflect on that. Over a two-year period, nearly the entire borrower base the private lending’s residential sector is financing becomes an entirely new group of people—and this churn continues to occur every two years. Although the industry continues to exist and work through the ups and downs, its borrower base is constantly changing.
This means origination requires significant resources, both money and time, to procure new borrowers on an ongoing basis. We wanted to see if we could quantify borrower acquisition costs, so we reached out to a few of our lender clients who collectively represent around $50 million per month of residential loan volume. In an informal poll, we asked them what they experienced.
BorrowER Acquisition Costs
Here’s some information based on our polling.
First, many lenders are actually unsure what their borrower acquisition costs are because they don’t calculate them. Surprising, but true. For lenders who do track this, we arrived at a cost of $2,500-$3,750 to acquire a new customer, which we defined by a funded residential real estate loan. That’s a hefty price. This true cost of acquiring a new customer includes multiple categories (see Table 1).
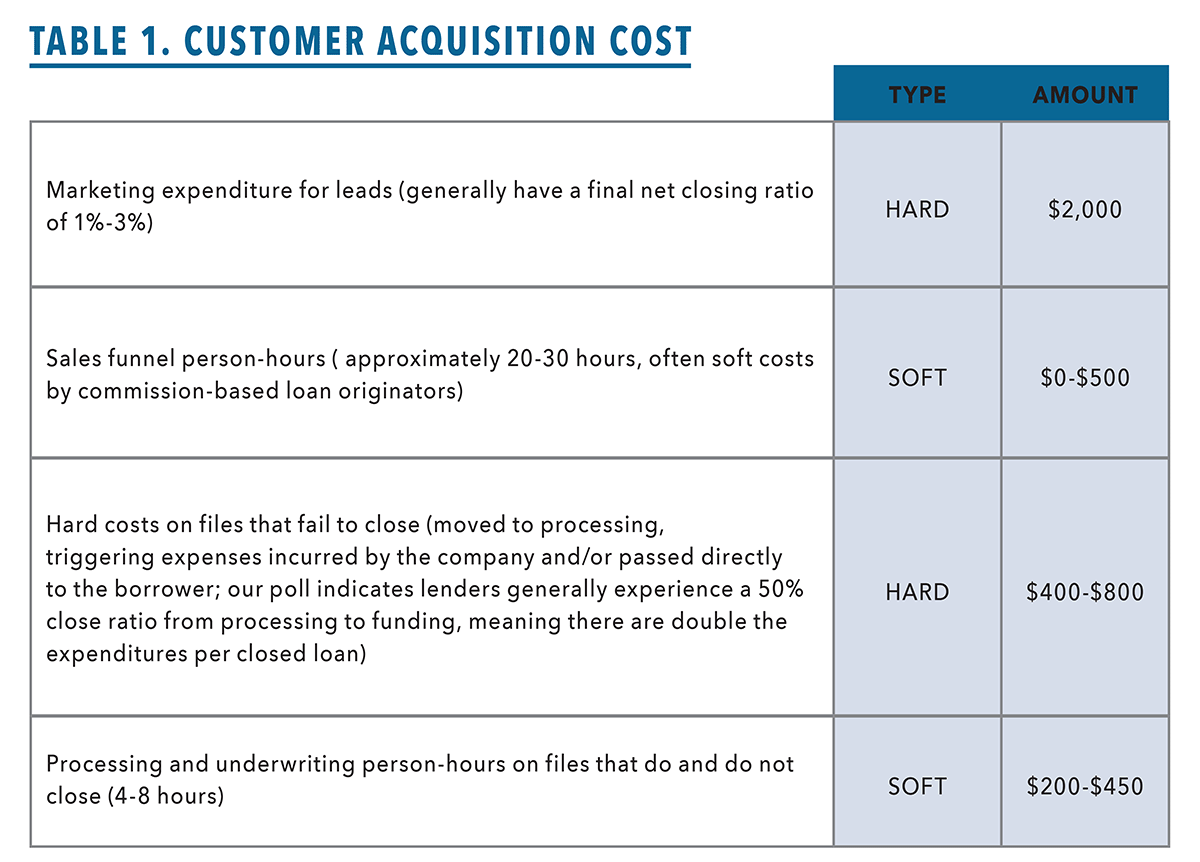
Total gross cost ranges from $2,500-$3,750 for acquiring new customers to reach a funded loan. On a $200,000 loan, that’s 1.25 to 1.875 points.
Repeat Customer Comparison
For repeat customers, the cost is significantly lower. To stay in front of that borrower, marketing expenditures certainly exist, but not nearly to the same tune of $2,000 in hard ad costs for lead generation. In addition, it’s likely the close ratio for repeat borrowers is higher than the 50% overall close ratio lenders might be experiencing. We did not ask the lenders whether they knew the close ratio for repeat borrowers. We estimated the cost for the second loan with a repeat borrower might be in the range of $600-$1,200, which is roughly 65%-75% lower (see Table 2).
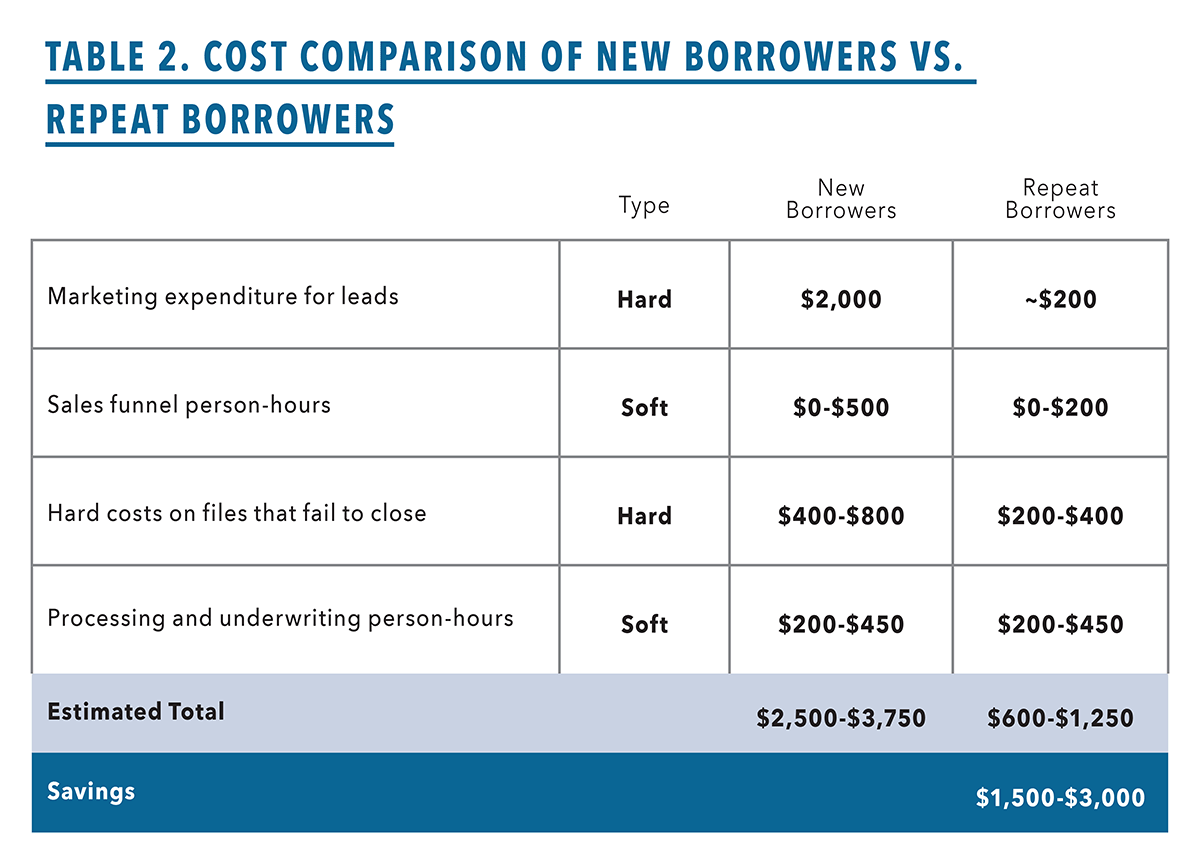
That saves you roughly $1,500-$3,000, which translates to .75 to 1.5 points that you get to now keep as an originator, instead of having already spent that money to acquire the borrower in the first place. That’s a big deal!
According to the research by BiggerPockets, the top three reasons why investors consistently fail in residential real estate are:
- Too much risk
- Not enough education
- Not enough analysis
What this means is that investing in the education of our borrowers and investors to help them ensure their profitability and longevity could have a meaningful impact on your own business profitability. If a borrower is kept in the game for an extra year, to do even one extra deal, then you get an extra loan on the books “for free,” saving .75 to 1.5 origination points to your profits.
Identifying the Right Renovation Strategy
The biggest driver of investor profitability from our perspective is identifying and executing the right renovation strategy. This decision typically has the single greatest impact on a borrower’s success (or failure) on a project.
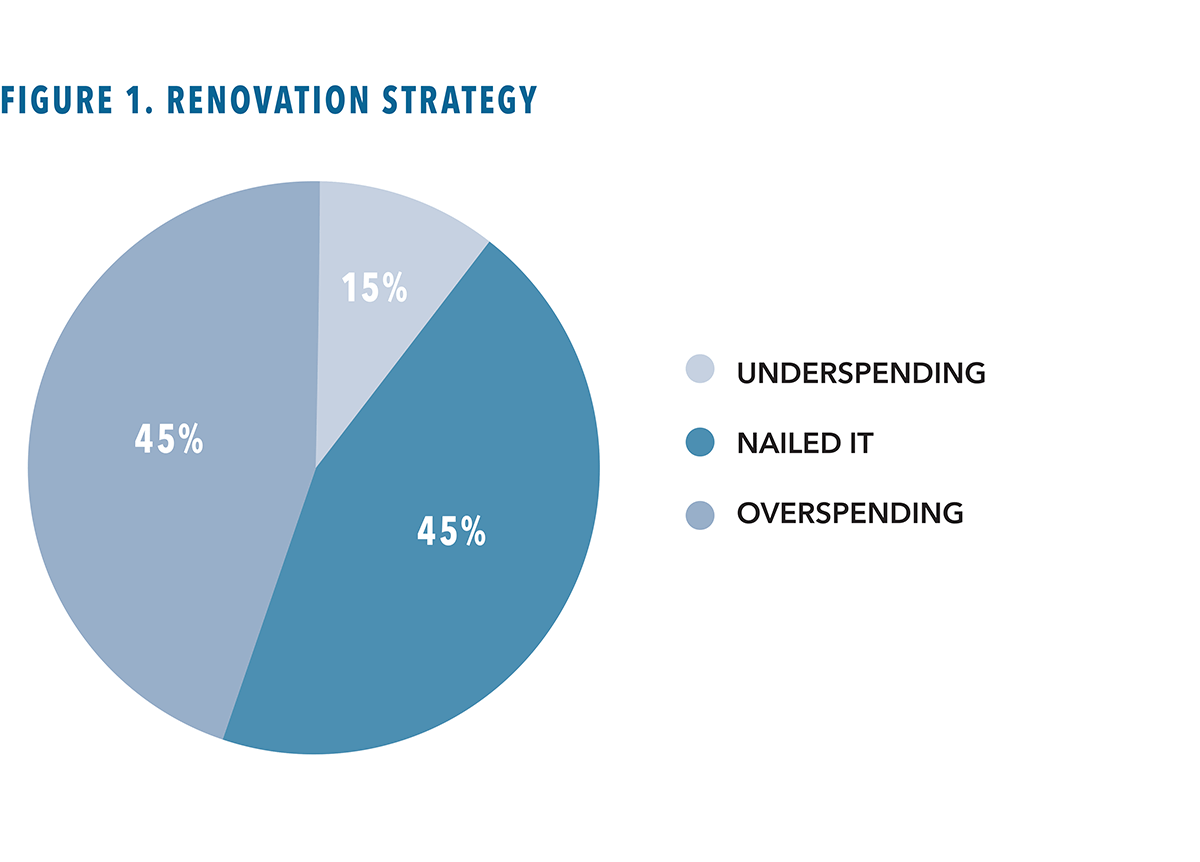
On a recent analysis of 3,000 Renovation Analysis reports by RicherValues, we found that borrowers were missing the mark on more than half of all projects, overspending on 45% of them, underspending on 10%, and hitting the optimal strategy on the other 45%.
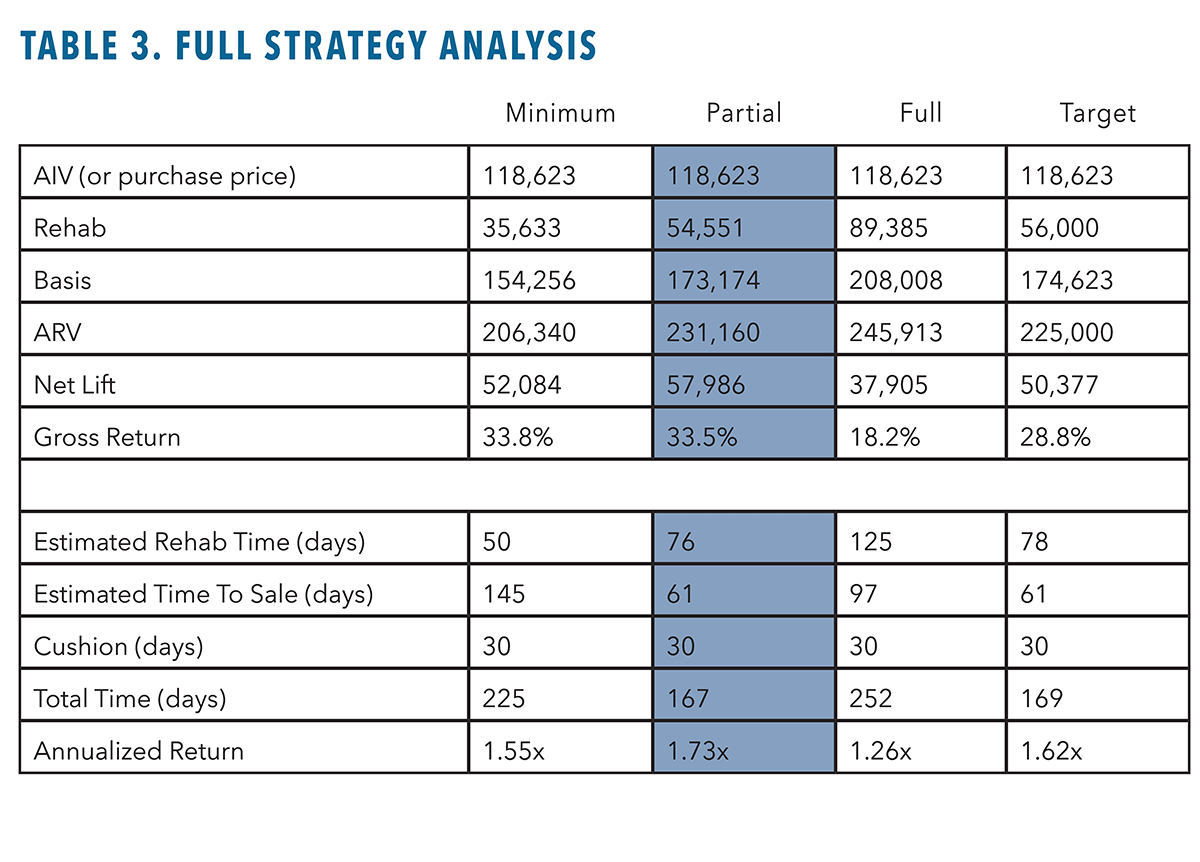
Here’s how this is determined. Our system and valuation reports quantify multiple renovation strategies for every project (minimum, partial, and full remodel as well as value-add expansions as applicable). For each strategy, we calculate estimated ARV, renovation costs, net lift, and estimated marketing time by renovation strategy based on the local neighborhood velocity and market dynamics. Together with estimated rehab completion times and a 30-day cushion, we calculate expected annualized returns off the basis, and the best strategy is identified as the one with the highest annualized return for the investor.
We then compare the borrower’s proposed budget and scope of work to identify the positioning within these renovation strategies. Optimal strategy means the borrower has proposed a strategy that represents or is within close range of the highest annualized return. Overspending means the borrower is targeting a higher level of renovation, which is expected to deliver diminishing returns to the investor. Underspending is the reverse: The borrower’s proposed budget is a lower-scale renovation where the market could deliver a higher annualized return by increasing the renovation scope (See Fig. 1).
As a private lender, you can make a significant impact on your borrowers’ investment performance and career longevity simply by helping them identify the optimal renovation strategy on projects.
Here are some key things to look for, which can help spark conversations and guide your borrowers. To truly identify the optimal renovation strategy on a deal and advise your borrower, you need to do some work. You should dive into the neighborhood and local comparables and find the subsets of comparables that represent a minimum remodel, partial remodel, and full remodel. From there, you calculate the estimated ARV for each strategy as well as the estimated renovation costs to accomplish each level. This full framework allows you and your borrower to evaluate strategies and find the most profitable one. (see Table 3 for an example).
If this analysis seems new or daunting to you, there’s no need to fret. If you have strong in-house talent, you can use property valuation software to run this analysis in minutes on every deal with high accuracy and hyperlocal comp data.
Alternatively, you can order renovation analysis reports instead of an appraisal. Depending on the provider, these kinds of reports typically cost around $450 and usually include an interior inspection, with turnaround times of three to five business days. Additionally, a growing number of loan buyers, warehouse lenders, and other financial institutions accept them in lieu of appraisals. Some valuation and appraisal providers may offer their own proprietary versions of this software and reporting, including RicherValues.
Potential Flags
In addition to the full strategy analysis in Table 3, here are some flags to look for that could indicate an issue with the deal (i.e., overspending or underspending). Identifying these factors for and with your borrowers can prove to be a winning strategy in the long term, even if it means the borrower must walk away from a deal that once looked attractive.
Low investor margins. One of the first flags you can look for is a low investor profit margin on the deal. This calculation is simple, involving these three things:
- Simple Basis = Purchase Price + Rehab
- Net Lift = ARV – Simple Basis
- Gross Margin = Net Lift ÷ Simple Basis
Depending on the market, a gross margin below 20% could be a concern, because all other project costs, financing costs, closing costs, etc. must come out of there before the investor keeps their return.
Low rehab multiples. The rehab multiple is also a simple calculation. Using the previous terms, this equals the Net Lift divided by the Rehab. If this multiple is less than 1.50, particularly if the budget is smaller, then this is another warning flag that either the deal itself just doesn’t have enough or the investor might not be optimizing the renovation strategy.
High renovation percent of ARV. As another flag, you can run a simple comparison of budget as a percentage of expected ARV. In our test samples of more than 3,000 projects, excluding new builds, we found the majority of projects that had a renovation percent of ARV greater than 21% were associated with budgets that represented overspending.
That’s not to say that all projects higher than this are definitely in the wrong, but it’s a nice indicator to look deeper. The renovation budget could be out of line with the exit values the local market will bear. If the property needs that much work, perhaps it is not economical to pursue this renovation. On the flip side, if the renovation budget has a lot of “discretionary” spending, then perhaps there are ways to cut down on the budget in way that might not lower the ARV by an equivalent amount. A low percentage of ARV, on the other hand, can be a good indicator the borrower could gain more by spending more.
Opportunities to Avoid Overspending and Underspending
If a flag pops up, you can look at the budget to find opportunities to reduce or increase the budget.
Some common line items to decrease a renovation to partial/minimum while still maximizing value is to look for items that could be refurbished instead of replaced. Often, these can include hardwood floors, kitchen cabinets, and other items that can be painted and given a makeover as a more cost-effective approach than replacement.
On the flip side, some items that can help spruce up a budget and bring extra lift to the sale price if a borrower’s budget is on the underspending side are replacing the front door, installing new appliances and new countertops, and painting the cabinetry for an updated color scheme.
The list goes on. Everything is market-based, down to the local neighborhood level. Although it can take some work to truly get to the set of deep answers, there are also some worthwhile flags to indicate a borrower might want to take another look.
In most cases, if you go the extra mile to help the borrower improve profitability and gain more experience, that borrower will almost certainly return to you for a loan on their next investment deal. Being able to help borrowers execute even one additional deal can have a major impact on your bottom line as a private lender—it’s a free deal with no new borrower acquisition costs.


Leave A Comment