
Lenders can better use real estate data to analyze the impact of rent changes and inflation on loan performance.
Inflation impacts both the top lines and the bottom lines of investors in apartments and single-family homes. Rising inflation influences rent prices and also impacts landlords’ input costs (e.g., wages, utilities, insurance, etc). Other market forces also play a role in determining rent: supply and demand for homes, house prices, migration trends. Rent, therefore, is slightly different from other consumer goods.
Statistically, shelter is 35% of the weight of the Consumer Price Index (CPI), which measures the price changes of a marketbasket of goods over time. However, the current methods of measuring rent are lagging due to manual survey-based data collection, small sample size, and bias. Only 20% of the total surveys are sent to renters for measuring CPI; the remaining are homeowners who are asked to guess what the rent would be for their homes.
The good news is investors and lenders can use contemporary and historical rent data, CPI, and rental indices to make loans more prudently and monitor their portfolios for stress.
To demonstrate, let’s apply rental data to a model loan portfolio. The portfolio is comprised of loans to properties in every state in order to analyze the impact of rent changes and inflation on loan performance. We’ll also analyze possible stress in debt service due to falling rents and rising costs for properties.
Why Now?
Investment activity peaked in 2021 for both apartments and homes. Per CBRE, U.S. apartment investment volume in 2022 decreased by 19% year-over-year to $278.8 billion, with the fourth quarter of 2022 falling by 34% quarter-over-quarter and 70% year-over-year to $48 billion. The sagging transaction volume and rising interest rates have impacted going-in capitalization rates from 3.4% in fourth quarter 2021 to 4.09% in third quarter 2022, per CBRE. This in itself would erode asset value by nearly 20% during this period.
Throughout 2021, keeping lending policy constant due to higher transaction volume and rising asset value prepandemic, lenders would have lent higher total dollar amounts and dollar per home to developers and investors looking to transact.
In this scenario, rent data creates a dynamic signal on market fundamentals lenders can use to understand and predict future trends. It allows lenders to make a thorough comparative analysis of markets and spot patterns required for both expanding lending activity and areas of stress.
Enter Rental Indices
Historically, price indices are used to compare home values across markets. For example, the Case Shiller indices cover home price changes for 20 metropolitan areas in the United States. They use a repeat-sales measure and collected data starting 1987.
Several research groups, including internet listing sites such as Zillow and Zumper provide average rents for cities in monthly rental insight reports. This information is useful for understanding relative price-points across cities and trends, but it has natural biases. More properties rent in the summer months versus winter (larger samples) and bigger properties (more bedrooms) rent for different prices per square feet than smaller ones, for example. An index like Case Shiller or CPI removes such skews.
Beekin’s rental indices measure the repeat-rent changes for properties when they are listed for rent again. A city (MSA), state, and national index of price changes is then created to update this index. The methodology is similar to CPI for empirical comparison purposes. Through big data, millions of homes can be indexed, monitored, and statistically separated for insights every month. Data science can truly shed a light on the changing face of rent, in near real time.
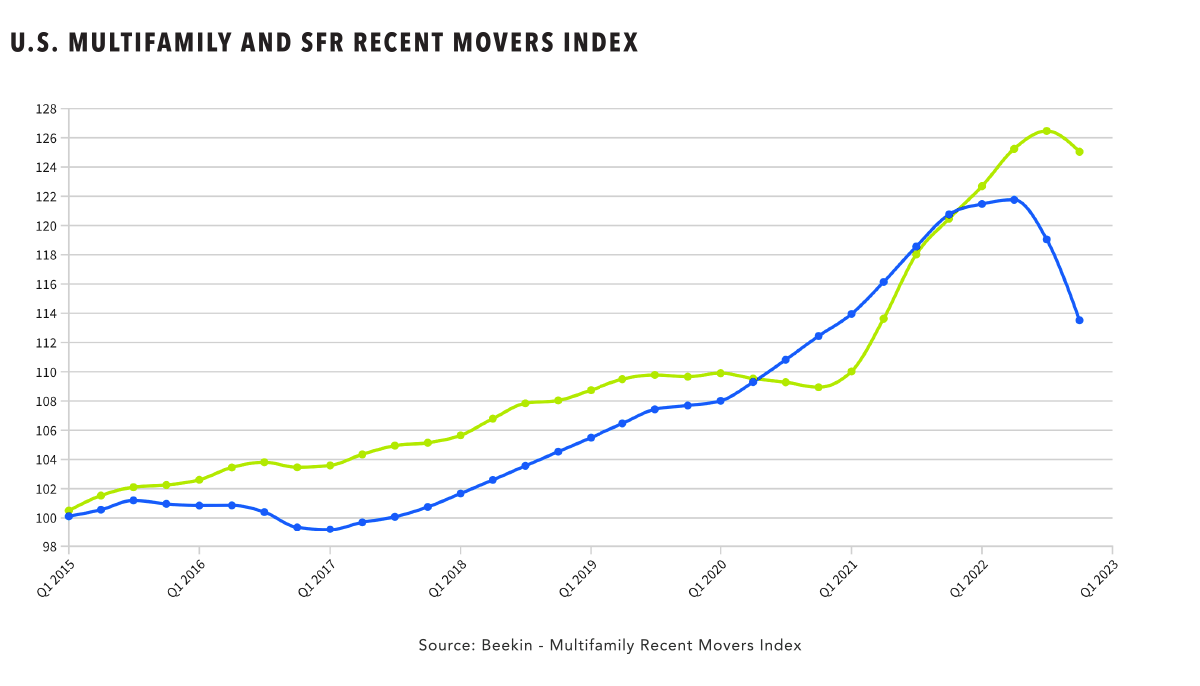
Finally, it is vital to recognize that single-family and multifamily properties behave differently. You can see from the U.S. Multifamily and SFR Recent Movers Index graph presented here that the multifamily price index is more growth-driven and has shown better rental consistency than single-family rental properties.
From first quarter 2015 to fourth quarter 2022, the data show rent increased until 2022 for homes and apartments. Due to household formation increasing in the prepandemic years, apartments commanded more premiums than single-family homes. Single-family homes remained resilient throughout the pandemic as more renters moved out of apartments to suburbs and homes due to remote working and the need for space.
In the aftermath of the pandemic in 2021, stimulus gave renters more liquidity. The housing supply shortage was exacerbated by an eviction moratorium in several states, causing a demand-supply imbalance and a spike in apartment rental rates, outpacing single-family homes.
Rent Is Hyperlocal
Real estate is hyperlocal, and rents follow the same pattern. During the past eight years, apartments traditionally grew more than single-family homes. It is vital to understand homes are preferred by a demographic that is less transient (e.g., families) than apartment dwellers. However, rising home prices can edge out several first-time buyers, forcing them to rent for longer.
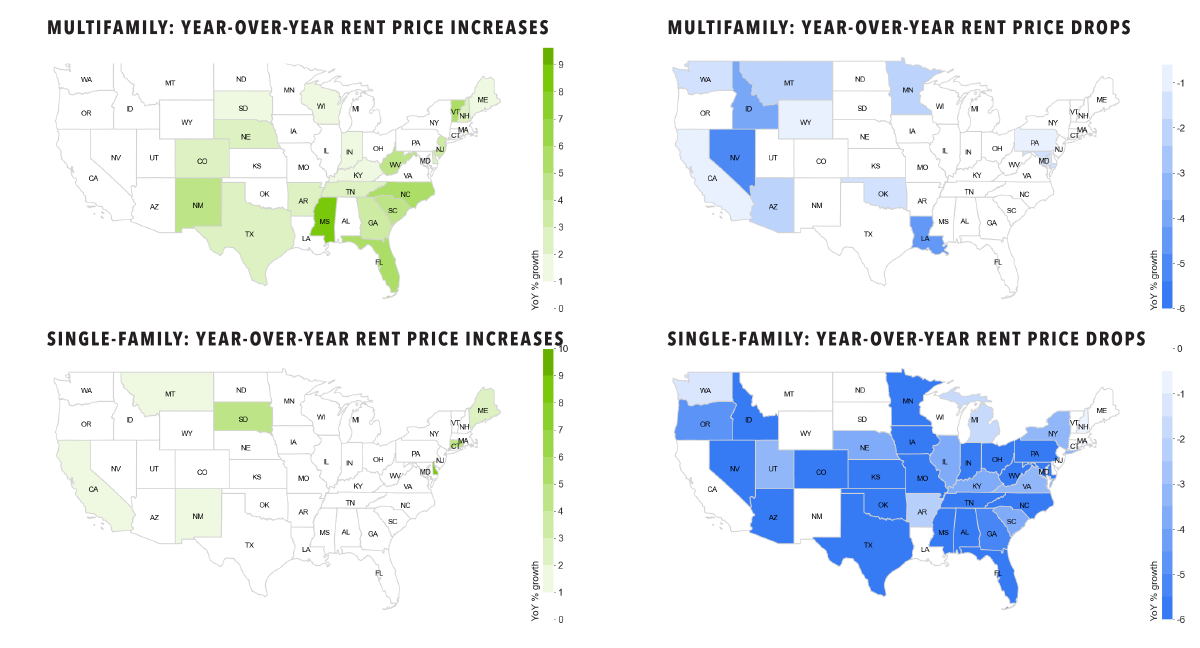
During the past 12 months, both apartments and single-family homes have seen a significant slowdown in rent growth, with single-family homes observing a bigger drop in rents versus apartments. This occurred because more single-family rental housing supply hit the market in 2022 when developers and fix-and-flip investors rented their homes as demand for purchase sagged.
In addition, credit card debt hit an all-time high at the end of 2022, eclipsing 2008. With rising delinquency in the 20-39 age group, rising affordability concerns directly impact the future outlook for rent and rent growth.
Apartment rent values showed the biggest increases in December 2022 over December 2021 for states with inbound migration (Sun Belt) but drops for the West Coast, where work from home and rising costs forced renters to other states.
Simulation: Two Model Loan Portfolios
To demonstrate, let’s consider two model loan portfolios—one secured against apartments in all states and the other with single-family rental units (see chart above). For ease of illustration, these models use round numbers, not actual rent values.
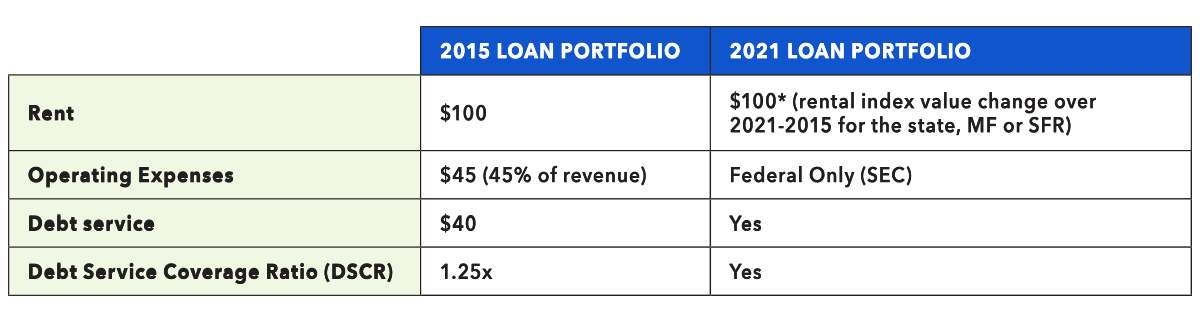
The models use 2015 as a base year for both rent and expenses. The assumptions for debt service are conservative. Per the St. Louis Fed multifamily price index, the asset value increased 209% between first quarter 2015 and fourth quarter 2022.
Next, rent indices by state were applied on the two portfolios to trend revenue. The value of the index represents the change in rent during the period. This, as well as the inflation-adjusted expenses, help simulate the overall impact to NOI (net operating income). In both cases, debt service coverage ratio (DSCR) was assumed to be constant at 1.25x, which is market standard. The following charts illustrate how the DSCR for the two model portfolios stood in 2022 (for the initial loan in 2015 and the new loan in 2021).
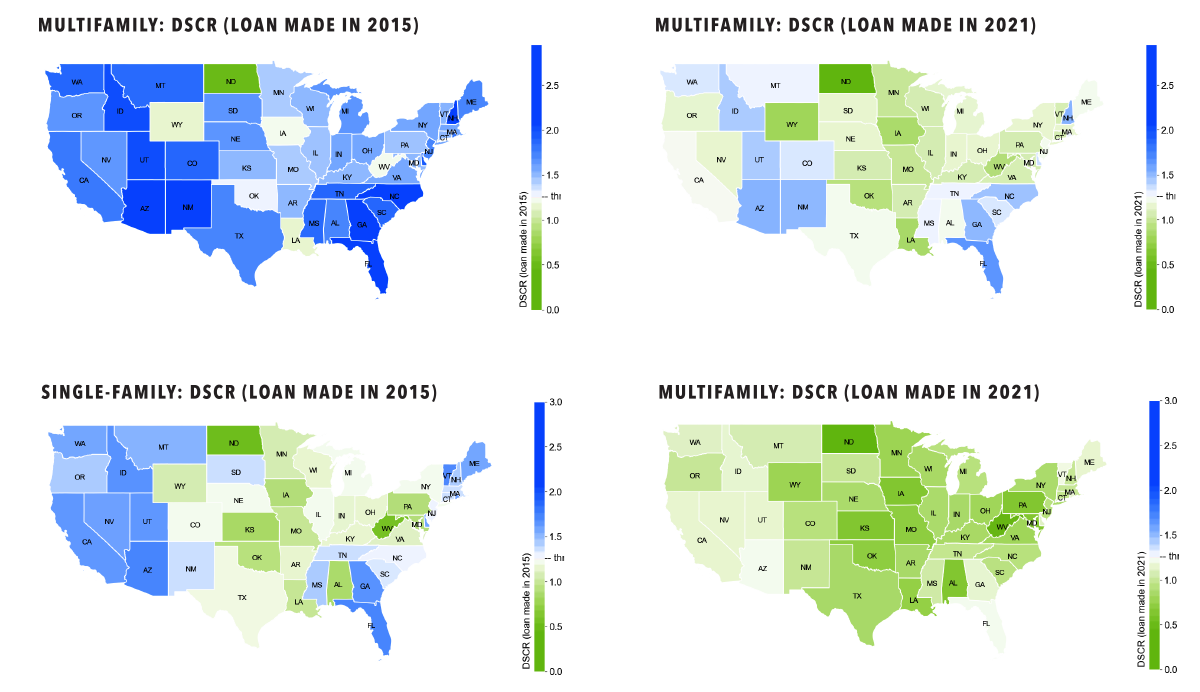
The loans made in 2015 were helped by generous rent growths, allaying the impact of an increase in operating costs in most states. However, the two 2021 loan portfolios for apartment and single-family show a stark contrast. Lower NOI in 2022 and higher opening leverage create a double whammy.
In the single-family market, you can see that by year-end 2022, in line with recent falls in rental prices, there are no longer any regions in the safe zone. As apartments in general have shown better rental resilience than single-family homes, both historically since 2015 and in recent times, debt coverage stands much stronger for apartment loans. States like Florida, Massachusetts, North Carolina, and New Mexico are among those with apartment loans that maintain healthy cash flow and debt coverage despite higher debt service versus 2015.
Broadly speaking, the West Coast and southeastern states of Georgia and Florida present themselves as safer regions, while Midwestern states (reaching out into the South and mid-Atlantic) may pose more risk.
As you can see, rent is a leading signal of where portfolio stress exists as well as where new lending can be a better risk-return. City-level rental indices are a great tool for quickly assessing market movement trends. Such tools allow underwriters, producers, mortgage brokers, and portfolio managers to quickly synthesize information without digging through mounds of data pools and aggregating spreadsheets to find a modicum of signal. These insights not only will be statistically rigorous and realtime but also allow lenders to outperform in their respective markets.


Leave A Comment