

Midwest and Southeast markets capture capital that coastal markets used to command.
The 2025 data shows a private lending industry transitioning into a new normal after years of rate-driven disruption.
Expanding the map
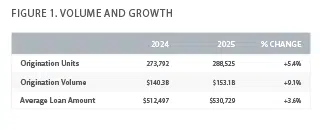
Growth occurred across every major topline metric, but the composition of that growth matters just as much as the aggregate percentages. Origination units increased 5.4% to 288,525, while dollar volume expanded 9.1% to $153.1 billion, indicating that market expansion was driven disproportionately by larger transactions rather than purely higher transaction counts.
Larger transactions are further demonstrated by a 3.6% increase in average loan size to approximately $531,000, despite elevated interest rates throughout much of the year. Several factors could contribute to this: a combination of higher property acquisition costs, increased rehabilitation budgets tied to inflationary construction costs, and growing lender confidence in asset-backed underwriting stability. Persistent inflation in labor and materials remained a defining factor across residential investment property markets throughout 2024 and 2025, particularly for value-add and construction-oriented lending activity (see Fig. 1).
Building density
Forecasa identified 15,865 active private lenders in 2025, a 14.5% increase over 2024’s 13,860. Although there was net growth, the market saw substantial churn. Notably, 6,128 lenders that originated in 2025 had not originated in 2024, representing 39% of the year’s active originator base. At the same time, 4,123 lenders that originated in 2024 did not originate in 2025. Net of those entrants and exits, the active lender base added more than 2,000 originators on the year.
Figure 2 indicates that private lending continues to attract entrepreneurial entrants and capital allocators even as consolidation pressures intensify. That combination typically signals a market viewed as structurally profitable rather than temporarily opportunistic—and one with plenty of specialized capital products to meet borrower needs.
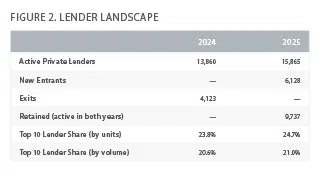
Concentration at the top remained essentially unchanged. The top 10 private lenders by unit count captured 24.7% of 2025 originations versus 23.8% in 2024, while the top 10 by dollar volume held 21% in 2025 versus 20.6% in 2024. The market continues to be defined by a stable, concentrated top end and a deeply fragmented long tail.
Growth Corridors
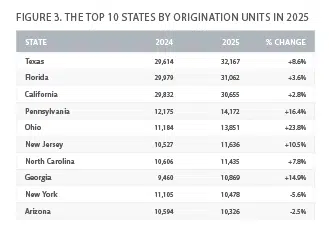
Geographically, the data indicate a meaningful redistribution of private lending activity away from purely coastal appreciation markets and toward operationally cash-flow-oriented regions in the Midwest and Southeast. Figure 3 shows Texas, Florida, and California remain the largest markets by unit count, which aligns with their population growth, housing turnover, and investor concentration.
However, the strongest percentage growth emerged from states such as Ohio (+23.8%), Pennsylvania (+16.4%), and Georgia (+14.9%), alongside metro-level acceleration in Cleveland, Detroit, Cincinnati, Milwaukee, and Kansas City.
Institutional and private investors have increasingly targeted these regions because yield compression in gateway markets reduced the attractiveness of appreciation-dependent strategies. Federal Reserve rate policy between 2022 and 2025 also materially increased financing costs, which generally favors markets where investment returns are supported by cash flow rather than speculative appreciation.
MSA-level expansion patterns further imply that private lenders increasingly prioritize scalable middle-market geographies where housing affordability remains intact.
Among 2024’s top 50 private lending metros, these are the biggest winners:
Minneapolis-St. Paul-Bloomington, MN-WI (+43.7%)
Kansas City, MO-KS (+42.1%)
Milwaukee-Waukesha, WI (+33.5%)
Cleveland, OH (+31.4%)
Birmingham, AL (+28.8%)
Detroit-Warren-Dearborn, MI (+24.3%)
Cincinnati, OH-KY-IN (+21.2%)
Portland-Vancouver-Hillsboro, OR-WA (+21.1%)
Riverside-San Bernardino-Ontario, CA (+19.6%)
Richmond, VA (+19.3%)
Minneapolis-St. Paul and Kansas City are particularly revealing because neither market has historically been considered a dominant speculative-investor hub. Their growth likely reflects migration of both borrowers and lenders toward markets with lower entry costs, more stable rent performance, and fewer regulatory constraints on housing development.
Similar trends have been documented nationally as investors moved capital into Midwest and Sun Belt metros offering stronger cap rates and lower volatility than coastal urban centers.
Declines were limited to a few select metros:
Sacramento-Roseville-Folsom, CA (-27.0%)
Baltimore-Columbia-Towson, MD (-14.1%)
Las Vegas-Henderson-North Las Vegas, NV (-9.9%)
San Francisco-Oakland-Fremont, CA (-8.5%)
Cape Coral-Fort Myers, FL (-8.2%)
Boston-Cambridge-Newton, MA-NH (-6.0%)
The contraction in markets such as Sacramento, San Francisco, Las Vegas, and Cape Coral suggests lenders became materially more cautious in regions exposed to valuation volatility, insurance cost escalation, affordability deterioration, or speculative investor saturation. Several of these metros experienced substantial pandemic-era appreciation followed by slowing transaction velocity and elevated carrying costs.
In Florida specifically, rapidly rising property insurance premiums and climate-related underwriting concerns have increasingly affected investment lending economics. Multiple national insurers reduced exposure or exited portions of the Florida market between 2023 and 2025 due to catastrophe risk and reinsurance cost pressure.
The Baltimore and Boston declines appear consistent with a risk-off reaction tied to fraud scrutiny and tightening underwriting discipline following the mid-2025 Fannie Mae fraud alert. Maryland also fell out of the top 10 states after declining 12.3% year-over-year. Secondary-market participants and warehouse providers often respond to fraud events with geographic overlays, heightened appraisal scrutiny, stricter documentation standards, or temporary pullbacks in perceived higher-risk regions.
Capital Markets
Activity on the secondary market increased in 2025. Private lending assignment transactions (assignments where the loan seller was a private lender) totaled 99,714 in 2025, up 5% from 94,545 in 2024.
That rise indicates continued maturation of loan liquidity infrastructure and stronger confidence among market participants in the transferability and valuation consistency of private credit assets. Secondary execution is becoming less episodic and more operationalized, which typically reflects deeper warehouse capacity, stronger investor appetite for short-duration real estate credit, and improved standardization in underwriting documentation and servicing practices.
The buy side of the market, however, is consolidating. The number of unique loan buyers active during the year declined 4.5% to 4,088 from 4,258. Additionally, the top 10 loan buyers of private lending loans accounted for 43.7% of all private lending assignments in 2025, up from 38.7% in 2024.
Fewer entities absorbing a larger percentage of available loan flow may signal that capital-intensive participants, including debt funds, REIT-affiliated buyers, family offices, securitization conduits, and institutional credit managers, are gaining pricing and negotiating leverage over smaller acquirers. This type of concentration pattern is common in maturing credit markets because scale advantages compound quickly. Larger buyers can absorb servicing complexity, diversify geographically, negotiate better financing terms, and tolerate thinner spreads due to lower funding costs. Smaller buyers often struggle to compete once markets become operationally sophisticated.
Looking ahead, increasing buyer concentration may gradually compress margins and increase dependency on a relatively small group of dominant capital providers. That dynamic mirrors the historical evolution of other nonbank credit sectors, where independent originators increasingly rely on a concentrated institutional investor base for takeout liquidity.
Turning the focus to originations, roughly 17% of private lending loans originated in 2025 had at least one associated assignment, down slightly from 18% in 2024. This rate will likely tick up modestly as more 2025 originations are sold and recorded in the months ahead.
While it is true that most private lending loans continue to be held by the originating lender, capital strategies vary widely across the top of the market. Some of the largest originators function as balance-sheet lenders that retain nearly all their production, while others originate-to-sell, transferring most loans to the secondary market within the first year. Among the top 25 lenders, we observe that about half are balance-sheet heavy (assign less than 15% of their loans) while the other half is equally split on a hybrid approach (assign anywhere from 15%-50% of their loans) and an originate-to-sell approach (sell more than 50% of their loans).
This assignment penetration rate demonstrates that the private lending market continues to prioritize interest income retention and long-term borrower relationships over fee-based origination velocity.
That being said, the substantial hybrid cohort indicates the market increasingly values optionality in capital strategy. Hybrid lenders can retain higher-quality or strategically important assets while distributing loans that optimize liquidity, geographic exposure, duration management, or concentration limits.
This flexibility becomes especially valuable in volatile rate environments where securitization economics, funding spreads, and borrower payoff behavior can shift quickly. The persistence of all three models—balance-sheet, hybrid, and originate-to-sell—suggests the private lending ecosystem has not converged around a single institutional template because different capital structures continue to produce viable economics under varying market conditions.
Vacant Land
Originations on vacant land properties grew 67% year-over-year to 24,650 units, with dollar volume up 44.8% to $19 billion. Vacant land’s share of total private lending units expanded from 5.4% in 2024 to 8.5% in 2025.
Vacant land is generally considered among the least liquid forms of real estate collateral because repayment often depends on future development or resale rather than existing cash flow. Expansion under these conditions signals strong lender conviction about future residential supply needs and land scarcity in growth markets. National housing supply shortages remained persistent entering 2025, with many analysts estimating the U.S. continues facing a structural underbuilding deficit accumulated over more than a decade. Private lenders appear increasingly willing to finance the earliest stages of the housing development pipeline in anticipation of continued demand pressure.
The disparity between unit growth and volume growth also implies that average vacant land loan sizes declined meaningfully, suggesting broader participation in smaller-balance land transactions rather than concentration in a limited number of institutional-scale development plays. That pattern is consistent with heightened activity among smaller developers, infill builders, and entrepreneurial investors targeting future residential construction opportunities in growth-oriented secondary markets.
The geography of vacant land lending is notably concentrated. The top five states (Florida, Texas, North Carolina, California, and Arizona) accounted for 55% of all vacant land private lending originations in 2025, well above the 43% Top Five concentration in the overall private lending market. Florida produced 4,921 vacant land originations, and Texas produced 4,260, representing 37% of the national total in just two states. North Carolina more than doubled its vacant land originations year-over-year (+137%), with Tennessee (+134%), Virginia (+123%), and Texas (+94%) close behind.
At the metro level, Florida placed four metros in the top 10 (Cape Coral-Fort Myers, Miami, Tampa, and Punta Gorda) and Texas placed two: Houston (which led all metros at 1,129 originations) and Dallas-Fort Worth. The remaining slots went to Phoenix, Atlanta, the New York metro, and Los Angeles.
This reinforces the thesis that private capital is positioning around long-term population migration and housing development trends. These states collectively share several characteristics: sustained domestic migration, relatively permissive development environments compared to coastal regulatory markets, continued household formation, and substantial suburban or exurban expansion corridors.
Population inflows into Sun Belt states remained a defining national housing trend throughout the post-pandemic period, particularly across Texas, Florida, North Carolina, Tennessee, and Arizona.
Florida’s growth is interesting, as it indicates lenders remain willing to fund land acquisition despite significant market challenges. On one hand, insurers and institutional investors have become increasingly cautious about coastal exposure and catastrophe risk. On the other, persistent population growth and housing shortages continue driving development demand in those markets.
Separately, the triple-digit growth in North Carolina, Tennessee, and Virginia is significant because it indicates the vacant land boom is broadening beyond traditional Sun Belt markets into emerging regional growth corridors. These states have benefited from manufacturing investment, logistics expansion, corporate relocations, and comparatively affordable housing stock relative to coastal metros.
Despite the geographic concentration, the lender side of vacant land is spread out. In 2025, 4,626 distinct private lenders originated a vacant land loan, a 27% increase over the 3,649 that did so in 2024. The top 10 lenders in vacant land captured 18.7% of niche originations, well below the 24.7% top 10 share in the overall market. The segment is served by a wide population of lenders.
That fragmentation suggests several things simultaneously: barriers to entry remain relatively low, underwriting standards are highly localized, and institutional consolidation has not yet fully penetrated the category. Land lending often depends heavily on market-specific knowledge about zoning, entitlement timelines, utility access, and local development economics. Those characteristics tend to favor regional operators and entrepreneurial lenders over fully centralized underwriting platforms.
Beyond the boom
Taken together with the broader market and capital markets data, the vacant land segment helps complete a larger picture of where private lending is heading structurally. The industry is no longer behaving primarily as a reactive alternative to conventional financing gaps. Instead, it increasingly resembles a parallel real estate credit ecosystem capable of funding projects across the entire property life cycle, from raw land acquisition through construction, bridge financing, rental stabilization, and secondary-market loan distribution.
Several interconnected themes emerge across all sections. Geographic capital flows are shifting decisively toward secondary and tertiary growth markets concentrated in the Midwest, Southeast, and Sun Belt. Investors and lenders are prioritizing affordability, cash-flow durability, and long-term demographic expansion over appreciation-dependent coastal speculation.
Simultaneously, the industry’s internal structure is bifurcating. On the origination side, lender participation is broadening, particularly in specialized categories as demonstrated by growth in vacant land lending. On the capital markets side, however, funding and secondary-market liquidity are consolidating into fewer large institutional buyers with growing influence over pricing and execution.
That combination, fragmented origination paired with concentrated capital markets, is characteristic of industries transitioning into institutional maturity. Community-level expertise and entrepreneurial sourcing remain essential at the front end, while capital efficiency and scale increasingly dominate the back end. The result is a market that appears larger, more liquid, more specialized, and more systemically interconnected than at any prior stage of private lending’s development.
The data also suggests private lenders are positioning for a longer-duration housing imbalance rather than a short cyclic rebound. Expansion into land acquisition, growth in development-oriented regions, and increased secondary-market sophistication all indicate confidence that housing undersupply, migration shifts, and constrained conventional credit availability will continue supporting demand for private capital solutions well beyond a single rate cycle. The industry is gradually evolving from “alternative lending” to embedded infrastructure within residential real estate finance.







Leave A Comment