
Second quarter 2023 trends are similar to first quarter.
 Overall, we’re seeing the same trends as we did in the first quarter: rising interest rates, rising fees, movement toward safer investments. Closing ratios are down significantly, indicating lenders are more selective about the loans they are willing to do.
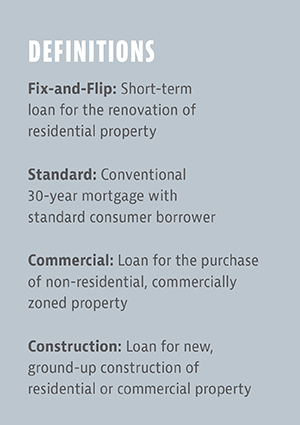
Note: These data include detailed breakdowns of numbers that are most likely to affect lenders’ day-to-day decision-making. However, numbers are based on national data, which may not be as relevant to your specific geographic area. The analysis is based on data exclusively from lenders who have undergone complete onboarding and actively utilized the system during both the first and the second quarters of 2023. The dataset encompasses nearly 15,000 loans, ensuring a comprehensive representation of the market dynamics during the specified period. Keep in mind that although the loan product definitions included here may serve as a guide for readers, lenders self-select the loan type for each transaction they enter into the platform.
Loans Created Volume: Down by 1.35% in Q2 over Q1 2023
Loan Positions: 99.19% of loans are first mortgages.
Borrowers (companies vs individuals): 8.87% of borrowers are companies/LLCs.
Payment Methods: 98.93% of borrower payments are done via ACH.
Closing Ratio: 30.67%—down from 43.32% in Q1 2023, indicating increased application scrutiny and fewer approvals, with construction loans declining most.
Average Days to Close: Average days to close is 22, almost unchanged from Q1 2023.


Leave A Comment