
Previously unavailable industry data made accessible through AAPL gives members a competitive edge.
Earlier this year, Lightning Docs, the official loan document platform of the American Association of Private Lenders (AAPL) joined forces with AAPL to bring to light up-to-date state-of-the-industry data that had previously been unavailable for those in the private lending sector.
The Data Pool
Lightning Docs’ algorithms have analyzed more than 39,000 loans worth more than $24 billion since 2018. The survey results for the first three quarters of 2023 captured more than 2,000 loans per month at a value of more than $1 billion in aggregate loan amounts per month.
After reviewing data gathered from this unique data set, we can confidently state that 2023 trends are not as bad as many prognosticated entering the year. In fact, our October 2023 State of the Union presentation showcased steadily improving numbers across both bridge loans and rental loans through the first three quarters of 2023.
Bridge Loan Volume Up 59% in 2023
A bridge loan in this context means an interest-only loan of 36 months or less duration, with a balloon payment after the term. Bridge loans may be fix-and-flip loans or construction loans, or they may contain no construction feature and simply be a short-term financing option to “bridge” the borrower to a future sale or refinance. According to our data, visualized in Table 1, bridge financing has grown by 59% from February 2023 to September 2023. February 2023 was a historic low point for bridge volumes nationally.
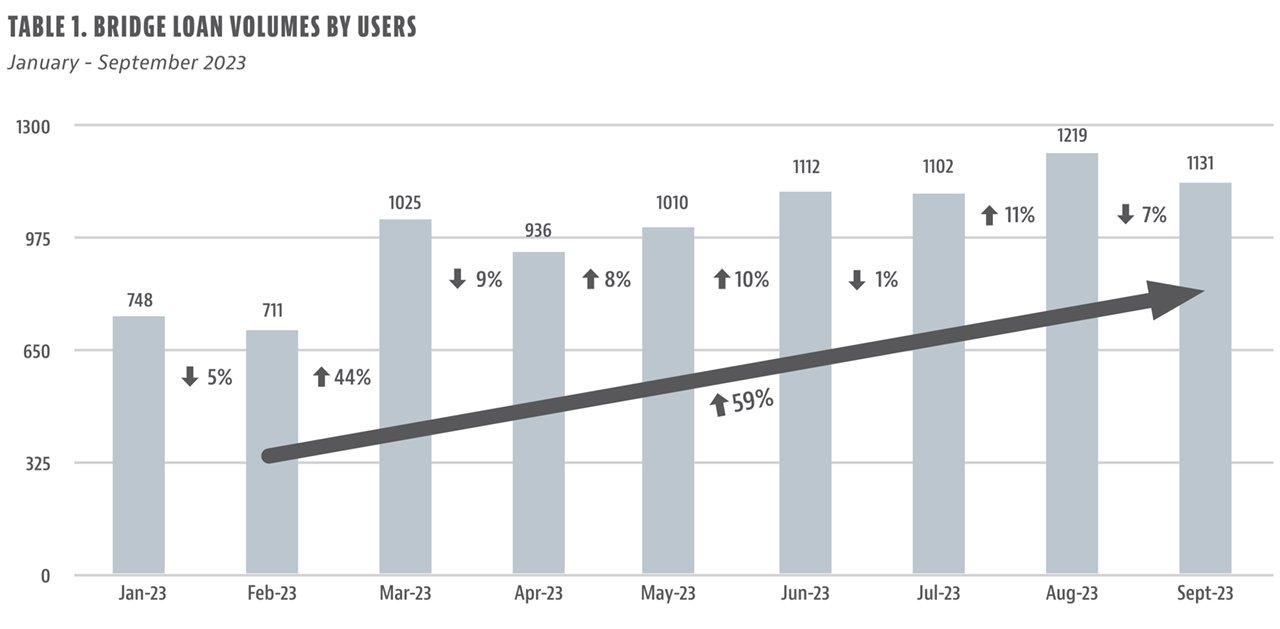
From March 2022 (which was an historical high point for bridge loan production) through September 2023, bridge loan volume is still down about 20%-25%. Therefore, this year’s overall production levels are expected to be less than last year in aggregate. Regardless, the sentiment of volumes is still better than expected from clients and users that we’ve polled.
Bridge Loan Interest Rates and Average Loan Amounts Hold Steady on Macro Level
Lightning Docs’ data in Table 2 showed that the national average interest rate has stayed fairly level throughout the year, with a low point of 10.97% in April and a high point of 11.27% in September, after starting the year at 11.08% in January 2023. The survey excludes any loans that it considers anomalies, including those with interest rates below 4% or above 15% as well as any loans greater than $2 million or less than $50,000.
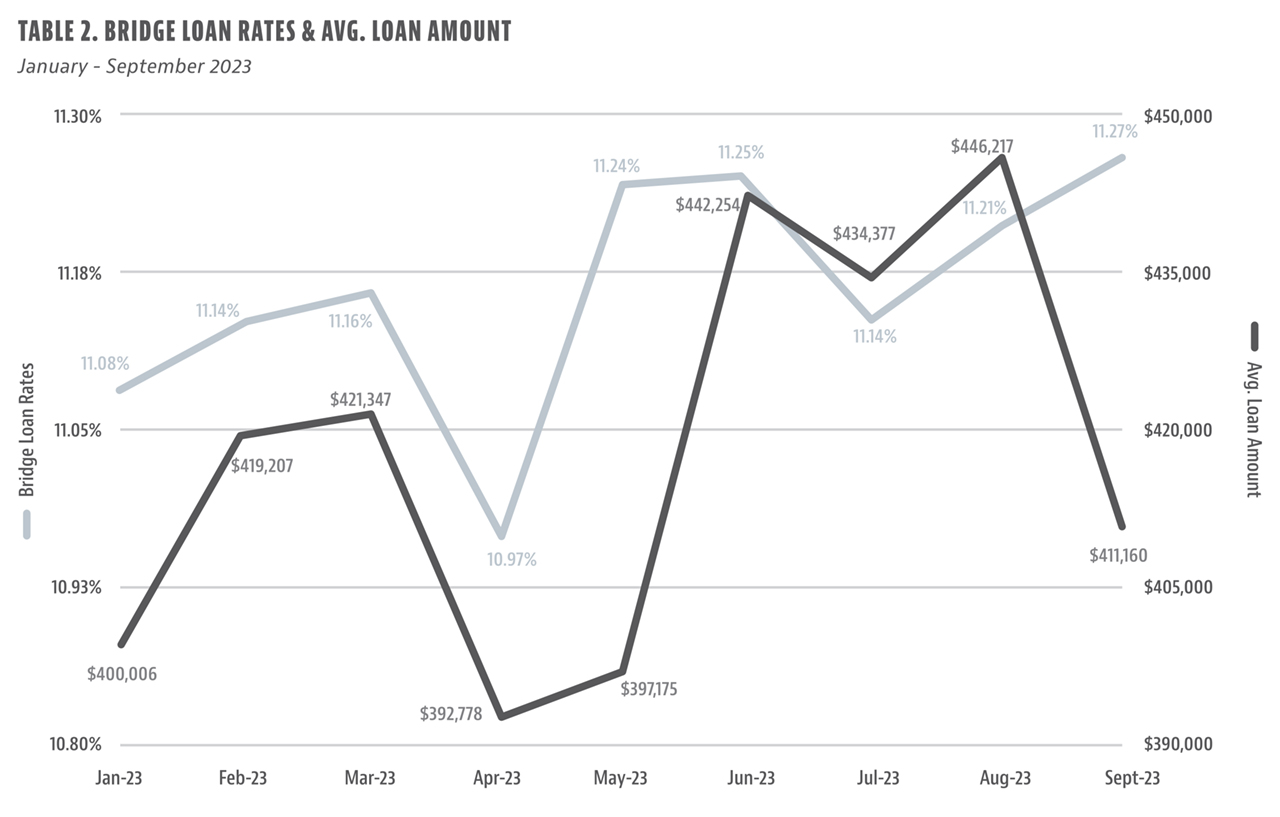
Similarly, the average loan amount fluctuated throughout the year. It started at almost exactly $400,000 in January, dipped to $392,778 in April, then rose dramatically to a high-water mark of $446,217. It then tumbled nearly 8% to finish at $411,160 in September.
Bridge loans are truly a local business, so although national data trends are interesting, one must understand what is happening at the local level to get an appreciation of any true rate and amount trends. A stark example of this fact is in Atlanta, Georgia, which is composed of two separate counties. There was a 100-basis point spread between those two counties in September 2023.
Even though national interest rates were an average of 11.3% for September 2023, there is a broad diversification of actual interest rates that comprise this amount. In September, 65% of loans had an interest rate between 11%-13%. Further analysis shows 36% of loans had an interest rate between 11%-11.99%; 29% of loans had an interest rate of 12%-12.99%; 18% of loans had an interest rate of 10%-10.99%; and 14% of loans had an interest rate of 13.01% or higher. The outlier of the bunch was interest rates below 10%—just 3% of loans fell into that stratum in the first three quarters of 2023. Funny enough, when clients ask about competition, many say their competitors are providing 9% financing. The data does not support these claims, as shown in Table 3.

Top Three States by Volume Hold Steady From 2022
As seen in Table 4, the top three states by volume of bridge loans held steady year over year for the first three quarters of 2023. California, Florida, and Texas took the top three spots for the second straight year, followed by Illinois and Georgia to round out the top 10. Upwardly mobile states in the volume chase included North Carolina at No. 6, up two spots from 2022, and New Jersey climbing from 13th to eighth in the same period.

New Jersey’s ascent is one of the most perplexing trends of the year considering its average interest rate of 10.79% is the lowest among the top 10 states, and it also has one the nation’s longest foreclosure processes.
Term Rental Loan Volumes on Steady Rise
Term rental loans, defined as 30-year DSCR (Debt Service Coverage Ratio) loans, mirrored bridge loan volumes through the first quarters of 2023, up by 57% from January and moving higher in almost every month this year. The biggest surge—31%—came in March.

In terms of state specific volumes, depicted in Table 5, Texas remains the No. 1 state for term-rental loans, while Pennsylvania surged up two spots to second among the states, bypassing both Florida and New Jersey. Also making big positive moves inside the Top 10 for the first three quarters of 2023 were Ohio, up five spots to fifth, and Maryland, up 5 spots to No. 9. Both Connecticut and California dropped out of the top 10 from 2022 to 2023, shown in Table 6.

Term Rental Interest Rates and Loan Amount Averages See More Volatility
Unlike bridge loans, which have remained fairly steady, according to Table 7, term rental loans are primarily securitized and much more sensitive to the movement of the Treasury markets. Term rental interest rates started the year at 8%, averaging just shy of $300,000 per loan. Interest rates dipped to a yearly low of 7.79% in May, while the low point for borrowing amounts was $246,774 in February. That number rebounded to a yearly high of $287,680 in March. Interest rates reached a yearly high of 8.31% in September, with an average loan amount of $271,639.

You can stay ahead of the competition with our ongoing State of the Industry webinar series, available to all current AAPL members.
For more information about Lightning Docs, visit https://lightningdocs.ai/ .


Leave A Comment