
Here’s a look at markets with the most overinflated home prices and those with the biggest backlogs of distress.
A home price slowdown and possibly even a correction is a growing risk facing U.S. housing markets for the second half of 2022. Rising inflation is forcing the Federal Reserve to implement contractionary monetary policy that will raise mortgage rates and put downward pressure on housing demand and home price appreciation.
The Fed is expected to raise its benchmark federal funds rate several times this year, and some forecasters are expecting those increases to translate into average mortgage rates at or above 4% by year’s end. Even before the the Fed raising interest rates, mortgage rates had risen to 3.69% by mid-February, according to the Freddie Mac Primary Mortgage Market Survey.
The real estate market has seen the risk of a home price correction emerge three times previously during the decadelong housing boom that took off in 2012: in 2014, 2018, and 2020.

In 2020, the freshest high-risk period in memory, the rising risk came from an external shock to the housing market in the form of the pandemic. In the three months immediately following the pandemic declaration, demand for housing took a nosedive and home price appreciation slowed dramatically. It was a short-lived trend that may be hard to remember, given the rapid and robust turnaround since then.
The housing slowdown risk emerging in 2022 looks much more like the scenario that played out in 2014 and 2018: a shift toward contractionary Fed policy putting upward pressure on mortgage rates and downward pressure on home price appreciation. A look back at how the housing market behaved during and after the 2014 and 2018 slowdowns provides some clarity on how it might behave in 2022.
A Brief History of Recent Housing Slowdowns
Starting in June 2013, average mortgage rates rose above their long-term average of 3.97% for 18 consecutive months, through November 2014. During this time, home price appreciation dropped from more than 10% in July 2013 to as low as 3.9% in July 2014. Home price appreciation dropped below its long-term average of 6% for seven consecutive months starting in April 2014 and ending in October 2014.
A similar pattern showed up in 2018, with average mortgage rates rising above their long-term average for 17 consecutive months, starting in January 2018 and ending in May 2019. The average mortgage rate during these 17 months was nearly 4.5% (4.46%). That was notably higher than the average rate of 4.25% during the 2013 and 2014 surge above the long-term average.
The slowdown in home price appreciation was also more dramatic in 2018 and 2019 than it was in 2013 and 2014. Home price appreciation slowed from 10% in March 2018 to as low as 0% in March 2019, and home price appreciation registered below the long-term average of 6% for 22 consecutive months, from April 2018 to January 2020.
Deeper Discounts During Downturns
To be clear, a home price correction is not a crash, and a slowdown in home price appreciation is certainly not a crash. A crash, like the one that occurred in the aftermath of the 2008 recession, resulted in home prices dropping 33% nationwide—more than double that in some markets.
A correction would look more like home prices dropping by low single digits, while a slowdown would mean home price appreciation slowing to low single digits. But even a slowdown could represent more, better-priced inventory for homebuyers and investors. This is particularly true for distressed properties, where bigger discounts are typically available when home price appreciation slows and housing inventory increases.
In the aftermath of the 2008 recession, with its 33% cumulative decline in median home prices, properties purchased at foreclosure sale sold for an average of 44% below their previous sale prices in 2011—the year before home prices bottomed out and began rising again. This is according to an Auction.com analysis of public record foreclosure sales data from ATTOM Data Solutions.
Average discounts to previous sales price for foreclosure sales steadily dropped in 2012 and 2013 to 33%, but they leveled off in 2014 and rose slightly to 34% in 2015 in the wake of the first Fed-triggered housing slowdown of the last decade. Distressed property discounts resumed their drop during the next two years, falling to as low as 19% in 2017 before rising again in 2018, 2019, and even 2020, following a 1% decrease in average retail home prices on an annualized basis in 2019.

Some markets are more at risk than others, stemming primarily from two preexisting risk factors: inflated home prices and backlogs of distressed housing. Of course, the markets most at risk are also those that potentially will provide the most opportunities for investors. Here’s a look at markets with the most overinflated home prices and those with the biggest backlogs of distress.
Markets with Most Price Risk
Housing affordability for local buyers provides a good yardstick for measuring the degree to which home prices in a market are inflated—or not. For this analysis, housing affordability was expressed as the price-to-income ratio using the median home sales price in fourth quarter 2021 from ATTOM Data Solutions and the most recent median family income estimates from the Census Bureau.
Given that many of the markets with the highest price-to-income ratios in fourth quarter 2021 have been chronically unaffordable over years, if not decades, it’s helpful to look at which markets have seen affordability diverge the most from their pre-pandemic level over the last two years.
Among 405 markets with at least 300 home sales in fourth quarter 2021, those with the biggest percentage increase in price-to-income ratios between fourth quarter 2019 and fourth quarter 2021 were Sevierville, Tennessee (96% increase in price-to-income ratio); Edwards, Colorado (74% increase); Coeur d’Alene, Idaho (67% increase); Barnstable Town, Massachusetts (65% increase); and Glenwood Springs, Colorado (62% increase). A common theme among those top five markets: All are popular vacation home markets, with the possible exception of Coeur d’Alene.
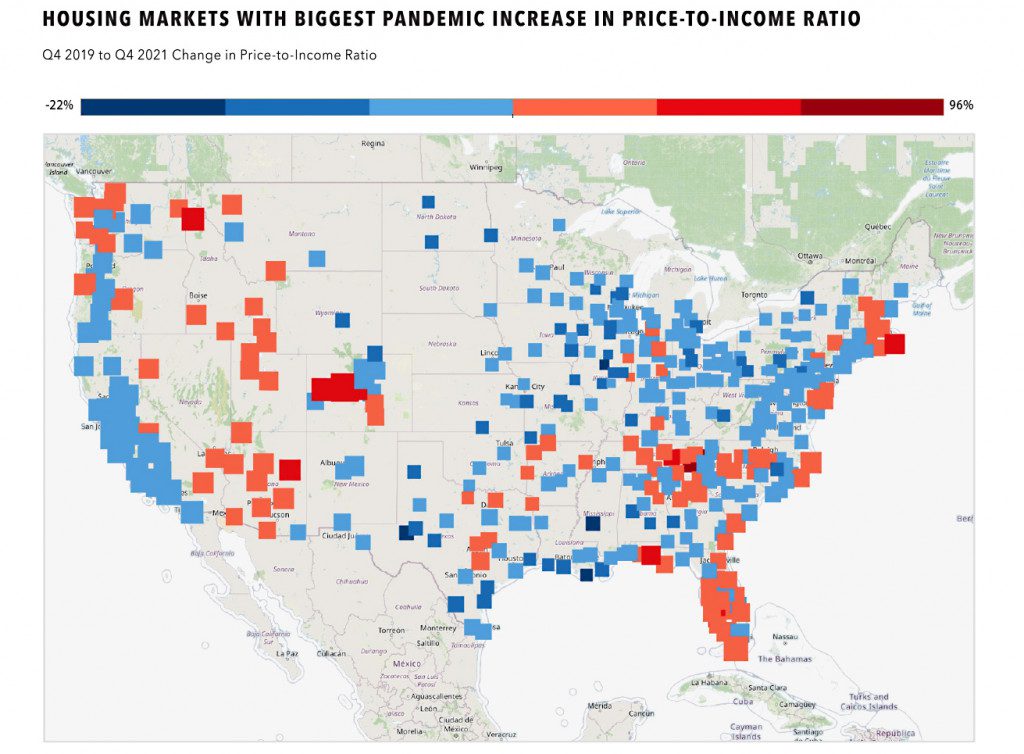
Among larger markets—55 with at least 5,000 home sales in fourth quarter 2021—those with the biggest increase in price-to-income ratios between fourth quarter 2019 and fourth quarter 2021 were Sarasota, Florida (up 51%); Phoenix, Arizona (up 51%); Cape Coral-Fort Myers, Florida (up 49%); Lakeland-Winter Haven, Florida (up 49%); and Austin, Texas (up 46%). Rounding out the top 10 were Tampa, Florida (up 43%); Tucson, Arizona (up 42%); Raleigh, North Carolina (up 42%); Charlotte, North Carolina (up 42%); and Nashville, Tennessee (up 41%). Each of these top 10 markets saw a bigger increase in price-to-income ratios than the nationwide increase of 37%.
Markets with Most Shadow Inventory
Markets with the biggest backlogs of delinquent mortgages held back from foreclosure during the pandemic are also at higher risk for a housing slowdown in 2022. As that shadow inventory of distressed properties returns, it will likely put downward pressure on retail market home prices.
The gradual return of this shadow inventory is likely not enough, on its own, to push home price appreciation negative. But even without a home price correction, the increase in distressed property inventory still represents more opportunities for real estate investors to purchase at a discount.
Data from Auction.com on the number of scheduled foreclosure auctions that were canceled or postponed in 2020 and 2021 provide a good proxy for potential shadow inventory of distressed properties that could return as foreclosure protections phase out. Taking this potential shadow inventory as a percentage of total existing home sales in 2021 helps gauge the level of impact it could have on each local market.
Among 499 metro areas with at least 1,000 existing home sales in 2021, those with the highest percentage of potential shadow inventory of distressed properties were Vineland-Bridgeton, New Jersey (19.6%); Yuma, Arizona (10.5%); Jackson, Mississippi (10.3%); Tucson, Arizona (8.2%); and El Centro, California (8.1%).
Among larger markets— 57 with at least 10,000 existing home sales in 2021—those with the highest percentage of potential shadow inventory of distressed properties were led by Tucson, Arizona followed by New York City (8.2%); Phoenix, Arizona (6.3%); Riverside-San Bernardino, California (5.9%); and Memphis, Tennessee (5%). Nationwide, potential shadow inventory of distressed properties represented 2.6% of all existing home sales in 2021.


Leave A Comment