Housing supply gradually began to increase in the second half of 2021, both in the larger retail market and in the narrower distressed property market—as predicted in a July 2021 article in this publication.
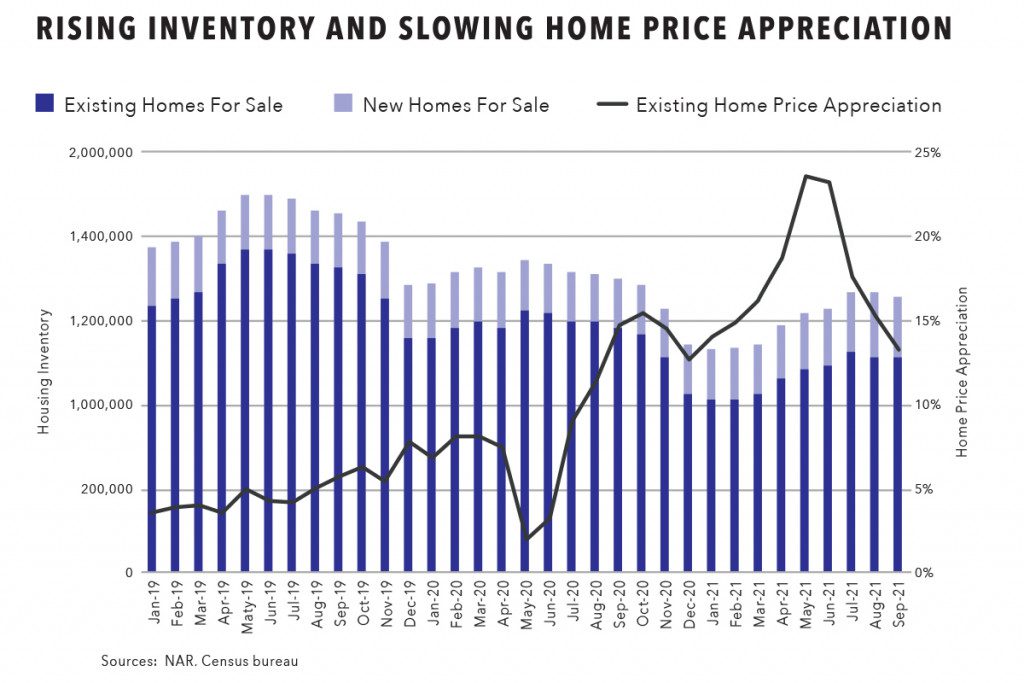
The inventory of existing homes for sale increased to an 11-month high of 1.3 million in July 2021 and remained near that level through September. Inventory of new homes for sale reached a nearly 13-year high of 379,000 in both August and September 2021. New home inventory for those two months was at its highest level since October 2008.
Supply also increased in the distressed real estate market, with the number of completed foreclosure auctions in third quarter 2021 up 16% from the previous quarter and up 89% from a year ago to a new pandemic-era high—although still 68% below pre-pandemic levels.
This gradual increase in supply is starting to ease some of the upward pressure on home prices and sets the stage for disciplined real estate investors to ramp up acquisitions in 2022—and to do so at price points that pencil out to profitable deals. The median sales price for existing homes increased 13.3% in September 2021, still a torrid pace, but well below the peak home price appreciation of 23.6% in May 2021.
Retreat in Retail Flipping Returns
Many of the deals will be found in the distressed property market, where investors are more likely to adhere to the “buy low” axiom, key to profitable real estate investing. The benefit of buying distressed properties with more value-add potential is evident when comparing so-called home flipping profits in the larger retail market to returns for investors who resold renovated foreclosure homes purchased on Auction.com.
Home flipping profits in the larger retail market dropped to a 10-year low in the second quarter of 2021, according to ATTOM Data Solutions. The second quarter 2021 average gross flip profit of $67,000—which does not include any renovation or holding costs—translated into a gross flipping return of 33.5%, the lowest since the first quarter of 2011.
The retail home flipping numbers include the high-volume flipping by iBuyers such as Opendoor, Offerpad, and Zillow, the latter of which exited the home flipping business in November due to the “unpredictability of forecasting home prices.” The iBuyer version of home flipping often involves purchasing properties at close to full market value and relying heavily on home price appreciation, along with relatively light rehab, to sell at a (hopefully) higher price a month or two down the road.
The retail home flipping data reflects the influence of the iBuyers. Properties flipped in the second quarter—meaning they were sold for the second time within a 12-month period—were originally purchased by the flipper at 88% of the estimated full market value on average. That 12% discount below full market value was the lowest purchase discount for retail home flippers as far back as data is available (Q1 2008).
Returns Rising for Renovated Foreclosures
In contrast, investors who resold renovated foreclosures in the second quarter of 2021 originally purchased the property at foreclosure or bank-owned (REO) auction for 61% of the estimated full “after-repair” market value on average, according to an analysis from Auction.com. This bigger discount reflects the more significant renovation needed to return these properties to retail condition. The properties were resold for 105% of full market value on average, a 44-point increase that represents the biggest value added by distressed property renovators since first quarter 2018, which is as far back as the Auction.com analysis goes.
The new high in value added by distressed property renovators translated into an increase in average returns for renovated foreclosures, counter to the trend in the larger retail market.
In the third quarter of 2021, renovated distressed homes resold for an average price of $264,989, a gain of $111,445 from the average purchase price at foreclosure auction or bank-owned (REO) auction. That gain represented an average 73% return on the original purchase price—not including holding costs and rehab costs. The 73% average gross return was the highest as far back as the Auction.com data is available: first quarter 2018 , as noted above.
It’s important to note that the rising returns with renovated foreclosures came with more significant renovation than the renovation typically performed with retail home flips. This is evident in the average days to resell a renovated foreclosure, which was 312 days on average for all renovated foreclosures resold between first quarter 2018 and second quarter 2021. Compare that to the average days to resell a retail home flip, which was 173 days on average during the same period.
This data demonstrates that the best home flipping returns typically come from properties purchased in the distressed marketplace that have plenty of value-add opportunity. Distressed property deals allow an investor to purchase at a discount below after-repair market value and add value through renovations rather than relying heavily on home price appreciation to generate profits.
So where should investors be looking for distressed property deals in 2022?
Although distressed supply is gradually rising nationwide, the supply situation is more favorable in some local markets and submarkets than others. Here’s where investors should be looking for the most distressed deals to emerge in 2022—both in terms of geography as well as in terms of loan type and value band.
Value-Add Opportunities by State
Nationwide, foreclosure inflow into the Auction.com platform increased 48% in third quarter 2021 compared to the previous quarter and was up 64% from a year ago. Despite the quarterly and annual increases, foreclosure inflow, which is predictive of the volume of properties brought to foreclosure auction in the following six months, was still just 23% of pre-pandemic volume in third quarter 2019.
States with the highest level of foreclosure inflow relative to pre-pandemic levels were Vermont, Maine, Connecticut, Wisconsin, Oklahoma, and Kansas—all above 50% of pre-pandemic levels. States with the most foreclosure inflow were California, Texas, Florida, Illinois, Ohio, and Missouri.
Value-Add Opportunities by Loan Type
Mortgages backed by the government-sponsored enterprises Fannie Mae and Freddie Mac accounted for 33% of all foreclosure inflow in the third quarter, the most of any loan type tracked by Auction.com.
Mortgages insured by the Federal Housing Administration (FHA) were in second position, accounting for 29% of all foreclosure inflow, followed by privately held mortgages (26%), mortgages insured by the U.S. Department of Veterans Affairs (8%), and mortgages insured by the U.S. Department of Agriculture (4%).
Foreclosure inflow on VA-insured mortgages increased to 31% of pre-pandemic levels in the third quarter, the most of any loan type, followed by FHA-insured mortgages (25%) and GSE-backed mortgages (23%).
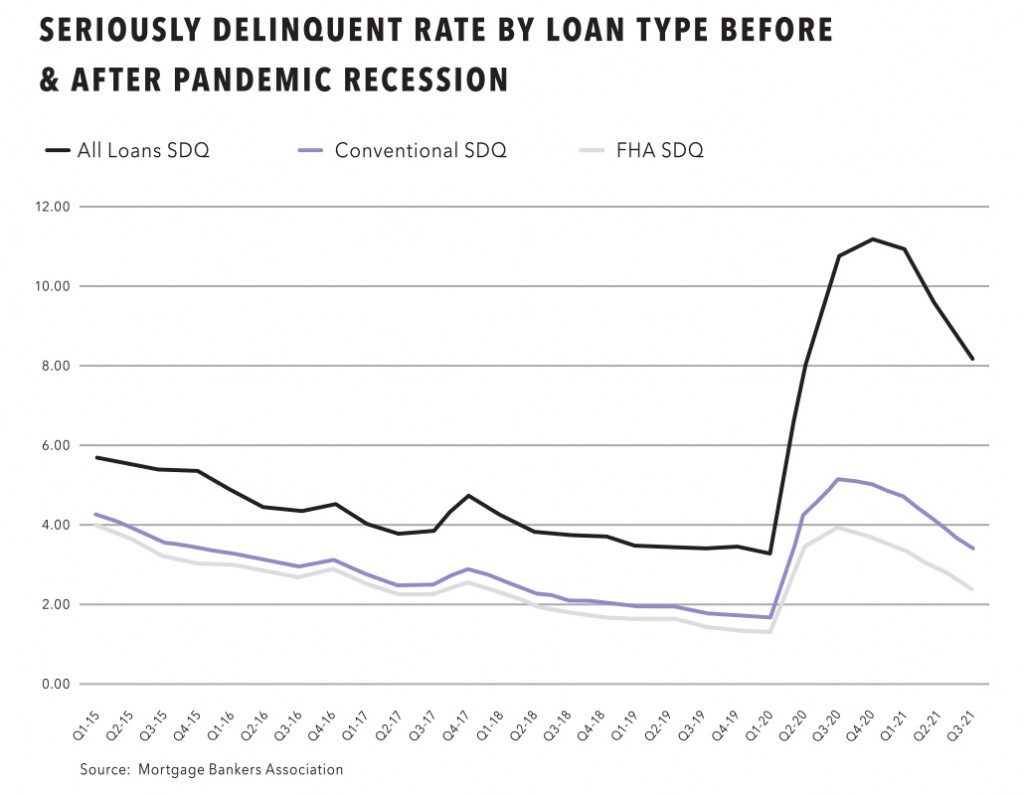
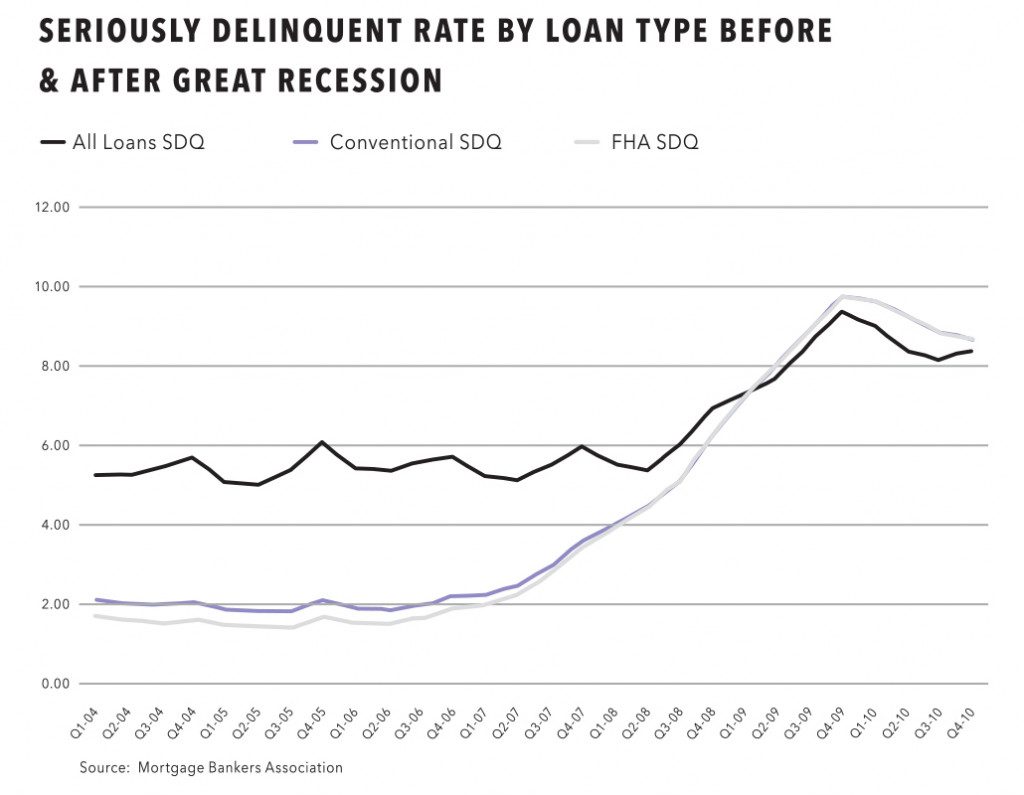
“I’m looking at the median-priced-and-below properties and FHA,” said Tampa, Florida-based real estate investor Lee Kearney, noting that seriously delinquent rates on FHA-insured mortgages spiked much higher than SDQ rates on conventional loans following the pandemic-induced economic shock, counter to the trend following the economic shock leading to the Great Recession in 2008.
Data from the Mortgage Banker Association shows SDQ rates on FHA loans increased 240% between first quarter 2020 and fourth quarter 2020, when they reached a peak of 11.19%. Meanwhile, SDQ rates on conventional loans increased 204% from first quarter 2020 to third quarter 2020, when they peaked at 3.95%.
By contrast, SDQ rates on conventional loans spiked 256% between third quarter 2007 and fourth quarter 2009, when they peaked at 9.83%. During that same period, SDQ rates on FHA-insured mortgages increased 70% to a peak of 9.42% in fourth quarter 2009. The Great Recession started in December 2007 and ran through June 2009.
“The numbers are showing that’s where inventory is going to be,” said Kearney, referring to FHA-insured mortgages. “If you have the most supply on that loan type, that’s where we’re going to target for pre-foreclosures, foreclosure auctions and REOs.”
Value-Add Opportunities by Value Band
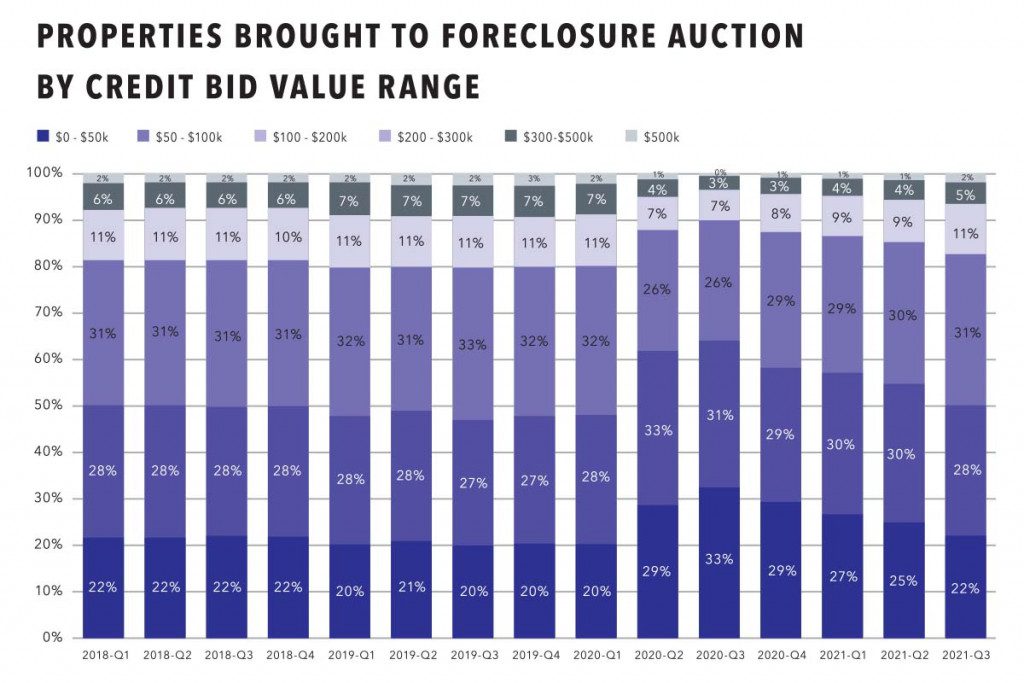
More than 80% of properties brought to foreclosure auction in the third quarter of 2021 had a credit bid of $200,000 or below, and about 50% had a credit bid of $100,000 or below. The credit bid is the amount owed to the foreclosing lender that often acts as the minimum reserve price at which the lender is willing to sell the property at foreclosure auction.
The share of foreclosure auctions with credit bids below $100,000 is up from 47% in third quarter 2019, prior to the pandemic, but it has been shrinking over the last year, down from 55% in second quarter 2021 and down from 64% in third quarter 2020.
Meanwhile the share of foreclosure auctions with credit bids above $100,000 has been steadily increasing during the pandemic, up from 45% in second quarter 2021 and up from 36% in third quarter 2020. Still, the share is down from 53% in the third quarter of 2019, prior to the pandemic.
The lower-priced skew of distressed properties also fits well into Kearney’s investment thesis for 2022.
”I’m looking to buy where institutions are not buying. This will more than likely be C and D class assets as well as luxury assets that do not fit the rental model,” he said.











Leave A Comment